Figures & data
Table 1 Primer sequences for RT-PCR
Figure 1 Physicochemical characterization of nanoparticles.
Notes: (A) Particle size distributions of VD-NPs; (B) CG-NPs; (C) zeta potential analysis showing surface charge distributions of VD-NPs; and (D) CG-NPs using dynamic light scattering analysis by Zetasizer.
Abbreviations: CG-NPs, CG-1521-loaded starch NPs; VD-NPs, void nanoparticles.
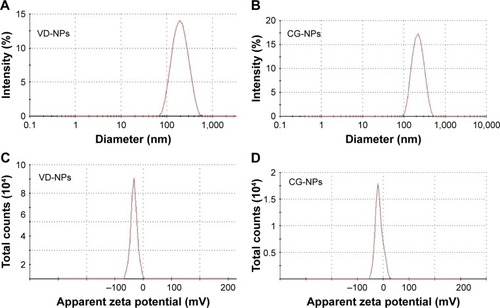
Figure 2 Morphological analysis of nanoparticles.
Notes: (A) Scanning electron microscopy image of nanoparticles for size and morphology analysis. The gold-coated nanoparticles at ×14,000 magnification, 20 kV; scale bar, 1 μm. (B) Atomic force microscopy of nanoparticles at ×67,000 magnification; scale bar, 1 μm. (C) FTIR spectra of a) VD-NPs, b) free CG-1521, and c) CG-NPs.
Abbreviations: CG-NPs, CG-1521-loaded starch NPs; VD-NPs, void nanoparticles.
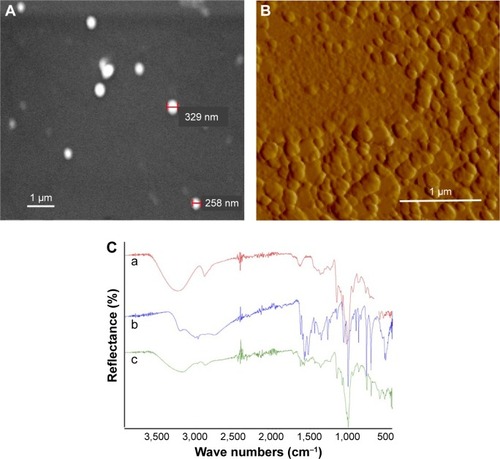
Figure 3 In vitro cumulative release of CG-1521 from NPs.
Notes: The cumulative release of CG-1521 at pH 7.4 (curve A) and pH 6.0 (curve B) over time was evaluated by dialysis method as described in the Methods section. The release of free CG-1521 at pH 7.4 (curve C) was used as control group. Data are expressed as mean ± SD (n=3). Statistical analyses of the data were performed using one-way ANOVA (Tukey’s test). *Differences between individual time points associated with curves A and B were considered to be statistically significant at P<0.05.
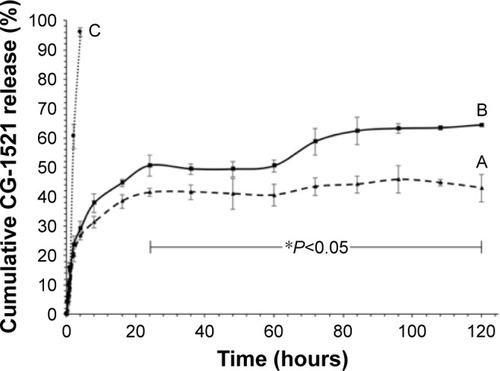
Figure 4 Cytotoxicity of free CG-1521 and CG-NPs against MCF-7 cells.
Notes: Quantitative analyses of cytotoxicity of free CG-1521 (blue) and CG-NPs (red) to MCF-7 cells after treatment with various doses. Cells were plated and grown for 48 hours prior to the start of treatment for 72 hours. Cells were fixed and stained with crystal violet assay as indicated in the Methods section. The results represent the mean ± SD from three different independent experiments. Statistical analyses of the treatments were performed using one-way ANOVA (Tukey’s test). *Differences were considered to be statistically significant at P<0.05.
Abbreviation: CG-NPs, CG-1521-loaded starch NPs.
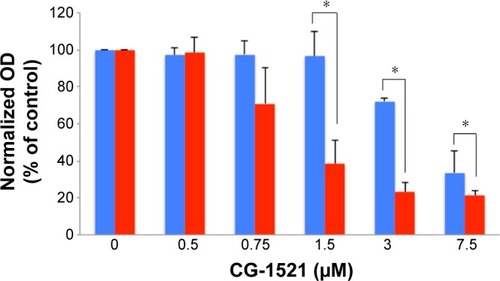
Figure 5 Comparison of the effects of free CG-1521 and CG-NPs on cell cycle kinetics in MCF-7 cells.
Notes: MCF-7 cells were treated with 3.0 μM free CG-1521, CG-NPs equivalent to 3 μM CG-1521 for 72 hours, fixed with ethanol (90%), and incubated overnight at −20°C to stain nuclei using a Muse cell cycle kit. Muse cell analyzer determined the percentages of cells in G1, S, and G2 phases. (A) DMSO; (B) CG-1521; (C) VD-NPs; (D) CG-NPs. One representative dataset from one of the three biological replicates is shown. Histograms have different scales on y-axes.
Abbreviations: CG-NPs, CG-1521-loaded starch NPs; DMSO, dimethyl sulfoxide; VD-NPs, void nanoparticles.
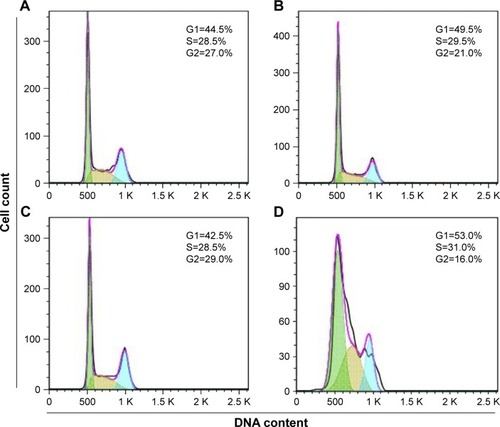
Figure 6 Comparison of the effects of free CG-1521 and CG-NPs on apoptosis and DNA fragmentation in MCF-7 cells.
Notes: (A) A representative apoptosis profile obtained by treating cells with free CG-1521 and CG-NPs. Nonapoptotic live (lower left), nonapoptotic dead (upper left), early apoptotic (lower right), and late apoptotic (upper right). A representative dataset from one of the three biological replicates is shown. (B) A representative DNA fragmentation profile in MCF-7 cells treated with free CG-1521 and CG-NPs. The detection of DNA strand breaks in apoptotic cells was determined by TUNEL assay as described in the Methods section. Dot plots represent 10,000 events of single population of cells. A representative dataset from one of the three biological replicates is shown.
Abbreviations: CG-NPs, CG-1521-loaded starch NPs; DMSO, dimethyl sulfoxide; TUNEL, Terminal deoxynucleotidyl transferase (TdT) dUTP Nick-End Labeling; VD-NPs, void nanoparticles.
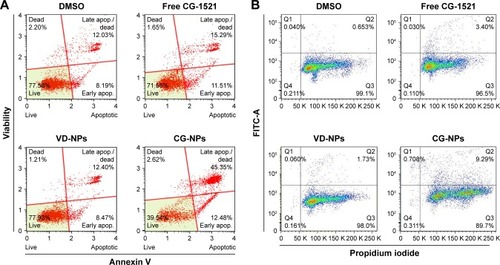
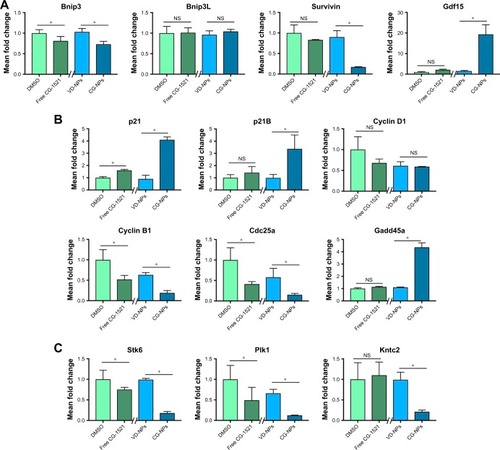
Figure 7 Changes in mRNA expression level of p53 target genes associated with cell death/apoptosis, cell cycle, and spindle formation in MCF-7 cells.
Notes: (A) Transcripts associated with cell death and apoptosis (Bnip, Bnip3L, Gdf15, and survivin). (B) Transcripts associated with G1/S and G2/M transition (p21, p21B, cyclin D1, cyclin B1, Cdc25a, and Gadd45a). (C) Transcripts associated with spindle formation/biogenesis in MCF-7 cells after 48 hours of treatment with free CG-1521 and CG-NPs were measured by qPCR. Relative transcript levels were measured by qPCR. The data shown are expressed as mean ± SD from three different independent experiments. Statistical analyses of the treatments were performed using one-way ANOVA (Tukey’s test). *Differences were considered to be statistically significant at P<0.05 (NS, not significant). Y-axes of transcripts have different scale.
Abbreviations: CG-NPs, CG-1521-loaded starch NPs; DMSO, dimethyl sulfoxide; VD-NPs, void nanoparticles.