Figures & data
Table 1 Characterization of Dox-loaded and siBcl-2/Dox co-loaded LPs
Figure 1 TEM images of Dox-LPs, Dox-TPGS-LPs, and siBcl-2/Dox-TPGS-LPs stained with phosphotungstic acid.
Note: Scale bar represents 500 nm.
Abbreviations: Dox, doxorubicin; LPs, liposomes; siBcl-2, Bcl-2 siRNA; TEM, transmission electron microscopy; TPGS, D-α-tocopherol polyethylene glycol 1000 succinate.
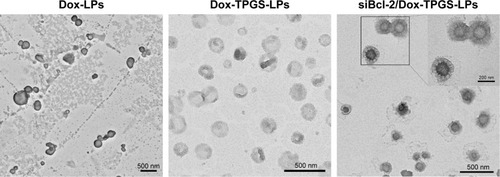
Figure 2 Release kinetics of Dox from free Dox, Dox-LPs, Dox-TPGS-LPs, and siBcl-2/Dox-TPGS-LPs incubated in PBS (0.01 M, pH 7.4) containing Tween 80 (1%, w/v) at 37°C.
Notes: Data are presented as mean ± SD (n=3). Some SDs are obscured as they are smaller than the symbols.
Abbreviations: Dox, doxorubicin; LPs, liposomes; siBcl-2, Bcl-2 siRNA; TPGS, D-α-tocopherol polyethylene glycol 1000 succinate.
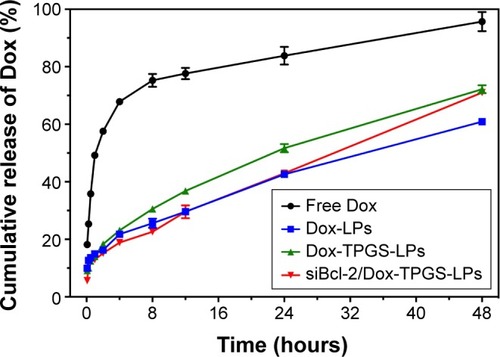
Figure 3 The cellular uptake of Dox in H22 cells was measured by flow cytometer after treatment with free Dox, Dox-LPs, Dox-TPGS-LPs, or siBcl-2/Dox-TPGS-LPs at a Dox concentration of 5 µg/mL for 4 hours; untreated cells served as a control.
Notes: Data are presented as mean ± SD (n=3). *P<0.05, compared with Dox-TPGS-LPs.
Abbreviations: Dox, doxorubicin; LPs, liposomes; siBcl-2, Bcl-2 siRNA; TPGS, D-α-tocopherol polyethylene glycol 1000 succinate.
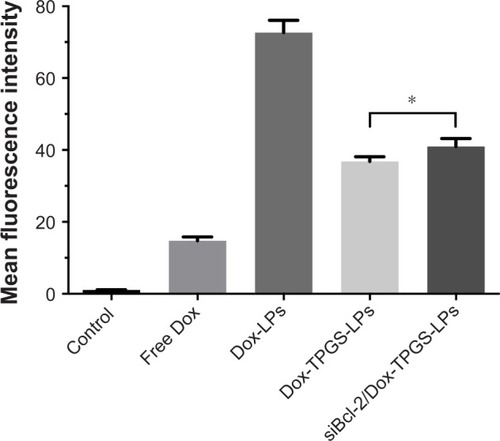
Figure 4 The cellular uptake and intracellular distribution of Dox and FAM-siRNA in H22 cells after being treated with free Dox, Dox-LPs, Dox-TPGS-LPs, or FAM-siRNA/Dox-TPGS-LPs (Dox, 5 µg/mL) for 4 hours.
Notes: Blue DAPI staining indicates the nucleus, and green FAM indicates siBcl-2 in the images. Scale bars represent 10 µm.
Abbreviations: Dox, doxorubicin; FAM, fluorescein amidite; LPs, liposomes; siBcl-2, Bcl-2 siRNA; TPGS, D-α-tocopherol polyethylene glycol 1000 succinate.
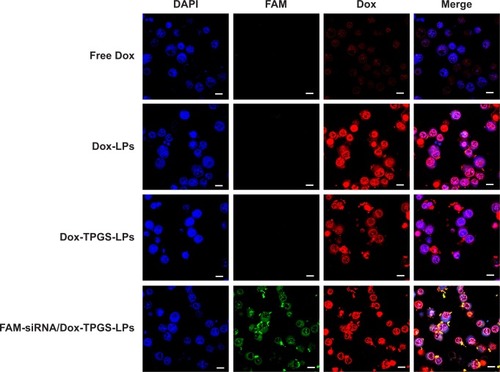
Figure 5 The cytotoxicity of the various formulations against H22 cells at the designed Dox concentrations after 24 hours.
Note: The IC50 of free Dox, Dox-LPs, Dox-TPGS-LPs, and siBcl-2/Dox-TPGS-LPs was 2.73, 0.83, 0.81, and 0.35 µg/mL, respectively.
Abbreviations: Dox, doxorubicin; IC50, half-maximal inhibitory concentration; LPs, liposomes; siBcl-2, Bcl-2 siRNA; TPGS, D-α-tocopherol polyethylene glycol 1000 succinate.
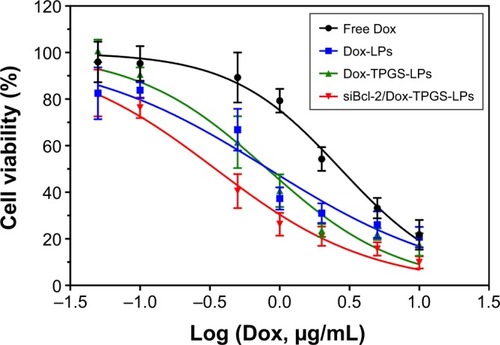
Figure 6 The images of H22 tumor spheroids treated with free Dox, Dox-LPs, Dox-TPGS-LPs, or siBcl-2/Dox-TPGS-LPs containing 5 µg/mL Dox for 72 hours; untreated tumor spheroids served as a control.
Note: Scale bars represent 50 µm.
Abbreviations: Dox, doxorubicin; LPs, liposomes; siBcl-2, Bcl-2 siRNA; TPGS, D-α-tocopherol polyethylene glycol 1000 succinate.
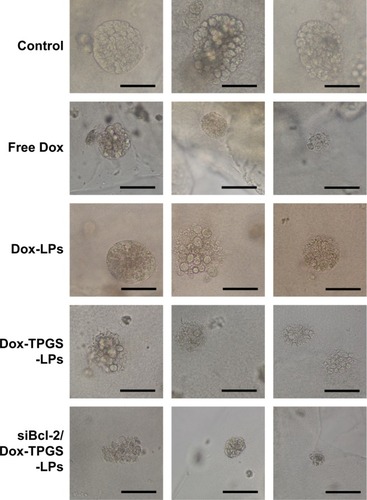
Figure 7 In vivo distribution and pharmacokinetics of the different formulations in H22 tumor-bearing BALB/c female mice.
Notes: (A) In vivo pharmacokinetics of siBcl-2/Dox-TPGS-LPs in BALB/c female mice after intravenous injection of free Dox, Dox-LPs, Dox-TPGS-LPs, or siBcl-2/Dox-TPGS-LPs at a Dox dose of 5 mg/kg (n=5). (B) In vivo fluorescence images of BALB/c mice with H22 tumors after the intravenous injection of various DiR-loaded LPs at different time points. (a) Free DiR, (b) DiR-loaded non-coated LPs, (c) DiR-loaded TPGS-coated LPs, and (d) siBcl-2/DiR co-loaded TPGS-coated LPs. Red arrows reprent the tumor sites in BALB/c mice. (C) Ex vivo DiR fluorescence images of excised organs (1: liver, 2: spleen, 3: kidney, 4: lung, 5: heart, and 6: tumor) at 24 hours postinjection. (a) Free DiR, (b) DiR-loaded non-coated LPs, (c) DiR-loaded TPGS-coated LPs, and (d) siBcl-2/Dox co-loaded TPGS-coated LPs. (D) Quantitative analysis of Dox in the excised organs of mice after intravenous injection of free Dox, Dox-LPs, Dox-TPGS-LPs, or siBcl-2/Dox-TPGS-LPs at a Dox dose of 5 mg/kg. Data are presented as mean ± SD (n=5). *P<0.05.
Abbreviations: DiR, 1,1′-dioctadecyltetramethyl indotricarbocyanine iodide; Dox, doxorubicin; LPs, liposomes; siBcl-2, Bcl-2 siRNA; TPGS, D-α-tocopherol polyethylene glycol 1000 succinate.
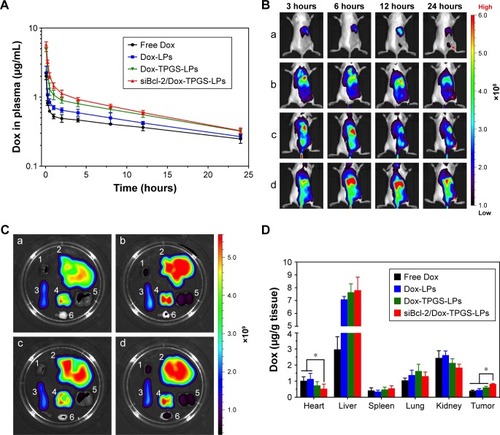
Figure 8 In vivo antitumor efficacy of the different formulations in H22 tumor-bearing BALB/c female mice.
Notes: (A) Tumor volume and (B) body weight changes during the treatment period. The black arrows on the x-axis represent the time points of intravenous injections (ie, Days 1, 3, 5, 8, and 11). The injected dose of Dox and siBcl-2 per administration was 5 mg/kg and 1.2 mg/kg, respectively (n=5). (C) The weight and (D) image of tumors separated from the mice at the end of the experiment. (E) H&E staining of the heart and tumor tissues, and immunofluorescence analysis of the tumor tissues. The red dotted circles represent damaged cardiomyocytes after free Dox treatment. Data are presented as mean ± SD (n=5). *P<0.05 and **P<0.01.
Abbreviations: Dox, doxorubicin; LPs, liposomes; siBcl-2, Bcl-2 siRNA; TPGS, D-α-tocopherol polyethylene glycol 1000 succinate.
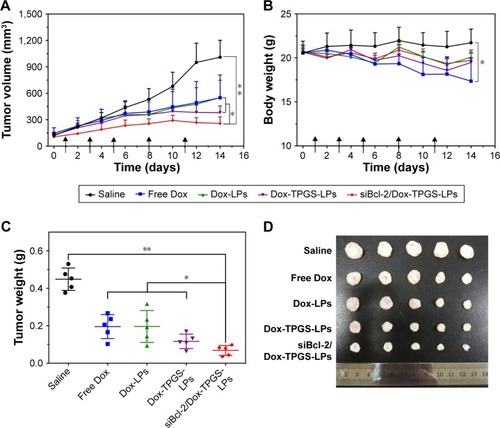
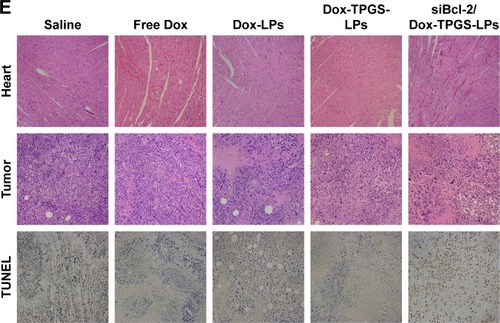
Figure S1 Entrapment efficiency, particle sizes, and zeta potentials of different formulations.
Notes: (A) The entrapment efficiency of siRNA in FAM-siRNA/Dox-TPGS-LPs with varied N/P ratios. (B) The particle sizes and zeta potentials of Dox-TPGS-LPs and FAM-siRNA/Dox-TPGS-LPs with varied N/P ratios.
Abbreviations: Dox, doxorubicin; FAM, fluorescein amidite; LPs, liposomes; N/P, nitrogen to phosphorus; TPGS, D-α-tocopherol polyethylene glycol 1000 succinate.
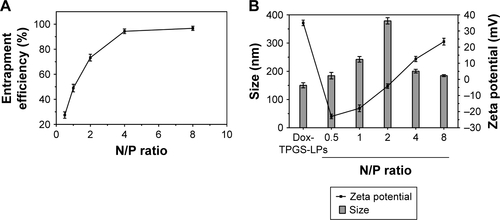
Figure S2 The cytotoxicity of blank liposomes (LPs and TPGS-LPs) against H22 cells at the designed total lipids concentrations from 1 to 200 µg/mL after 24 hours.
Abbreviations: LPs, liposomes; TPGS, D-α-tocopherol polyethylene glycol 1000 succinate.
Figure S3 Blood biochemical indicators, including liver-related ALT and AST, kidney-related BUN and CRE, and heart-related LDH and CK-MB, in the blood samples of mice were analyzed on Day 15 after treatment with different formulations. *P<0.05.
Abbreviations: ALT, alanine aminotransferase; AST, aspartate aminotransferase; BUN, blood urea nitrogen; CK-MB, creatinine kinase-MB; CRE, creatinine; Dox, doxorubicin; LDH, lactate dehydrogenase; LPs, liposomes; siBcl-2, Bcl-2 siRNA; TPGS, D-α-tocopherol polyethylene glycol 1000 succinate.
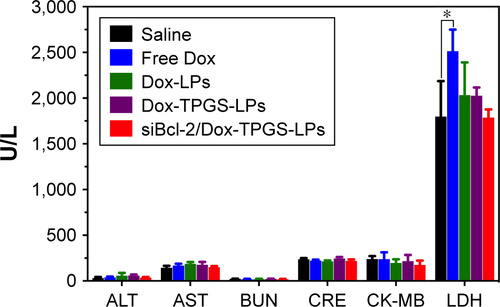
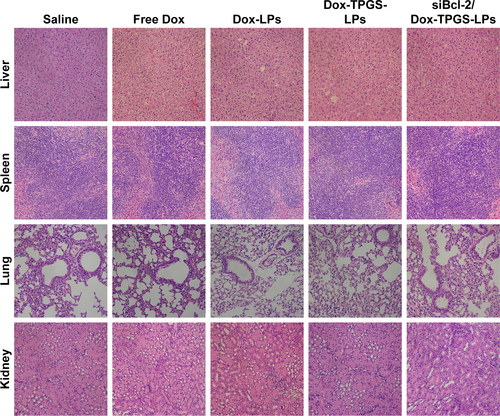
Figure S4 H&E-staining of liver, spleen, lung, and kidney extracted from the mice on Day 15 after treatment with various formulations.
Abbreviations: Dox, doxorubicin; LPs, liposomes; siBcl-2, Bcl-2 siRNA; TPGS, D-α-tocopherol polyethylene glycol 1000 succinate.