
Figures & data
Table 1 Ex vivo skin-permeation profile of three 8-MOP ME formulations
Figure 1 Ex vivo skin-permeation profile of the three ME formulations (n=6).
Notes: (A) Cumulative 12-hour 8-MOP permeation; (B) comparison of amount of 8-MOP retained and permeated in the skin and calculated retention:permeation ratio (****P<0.0001). Formulation A showed a significant higher amount of 8-MOP retained in the skin than formulation B and C, formulation A also showed the highest ratio of retention/permeation.
Abbreviations: ME, microemulsion; MOP, methoxypsoralen.
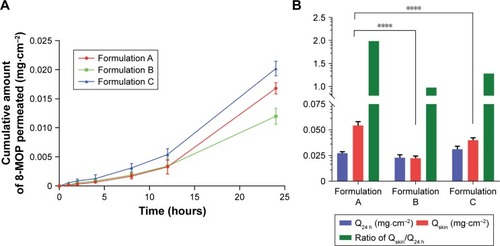
Table 2 Physiochemical characterization of 8-MOP MEs and four chitosan derivative-coated 8-MOP MEs
Figure 2 Appearance and micromorphology of ME formulations.
Notes: (A) 8-MOP MEs; (B) HC-MEs; (C) CC-MEs. Size distribution assessed by dynamic light scattering; images observed under transmission electron microscopy.
Abbreviations: ME, microemulsion; MOP, methoxypsoralen; HC, hydroxypropyl chitosan; CC, carboxymethyl chitosan; PDI, polydispersity index.
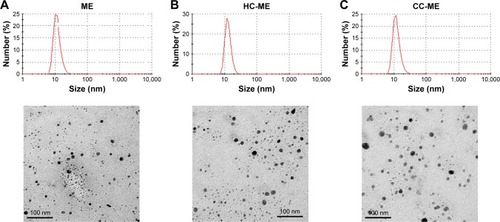
Table 3 Ex vivo skin permeability of 8-MOP MEs, chitosan derivative-coated 8-MOP MEs, and 8-MOP tincture
Figure 3 Ex vivo skin-permeation profile of the selected ME formulation, HC-MEs, CC-MEs, AC-MEs, LC-MEs, and tincture (n=6).
Notes: (A) Cumulative 12-hour 8-MOP permeation of skin; (B) comparison of 8-MOP retained and permeated in skin and calculated retention:permeation ratio (****P<0.001, **P<0.01). MEs showed a significantly higher amount of 8-MOP retained in the skin than all chitosan derivative-coated MEs, and also showed the highest ratio of retention:permeation.
Abbreviations: ME, microemulsion; HC, hydroxypropyl chitosan; CC, carboxymethyl chitosan; AC, acetic chitosan; LC, lactate chitosan; MOP, methoxypsoralen.
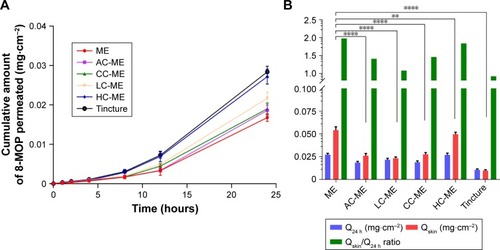
Figure 4 Rats under in vivo pharmacokinetic study.
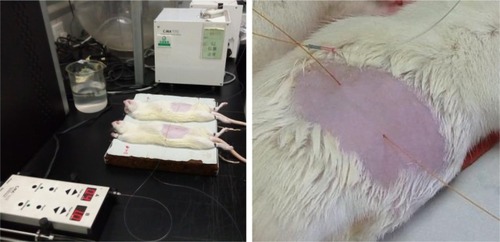
Figure 5 In vitro and in vivo recovery from microdialysis (n=5).
Notes: RR was obtained by the incremental method and RL by the decremental method. (A) In vitro RR and RL for different concentrations of 8-MOP (5, 50, and 600 ng mL−1) perfused. RR and RL showed no significant difference, and RL was used as an alternative for RR. (B) In vivo recovery (RL) for different concentrations of 8-MOP (5, 50, and 600 ng mL−1). In vivo recovery was consistent for different concentrations of 8-MOP. (C) Stability of in vivo recovery during 12-hour testing, when a moderate concentration of 8-MOP (50 ng mL−1) was perfused. In vivo recovery over 12 hours was generally stable for analysis.
Abbreviations: MOP, methoxypsoralen; RR, relative recovery; RL, relative loss.

Table 4 Pharmacokinetic parameters of microdialysate samples
Table 5 Pharmacokinetic parameters of plasma samples
Figure 6 In vivo pharmacokinetic profile of 8-MOP MEs, HC-MEs, CC-MEs, and tincture (n=6).
Notes: (A) Dermal concentration–time profiles over 12 hours of 8-MOP retained in the skin; (B) 12-hour plasma concentration–time profiles of 8-MOP; (C) comparison of 8-MOP retained (AUCdialysate) and permeated (AUCplasma) in skin and calculated retention:permeation ratio (compared to tincture, ****P<0.001, **P<0.01, *P<0.05; compared to MEs, ##P<0.01, #P<0.05). MEs showed a significantly higher amount of 8-MOP retained in the skin than any other formulation, as well as the highest ratio of AUCdialysate:AUCplasma.
Abbreviations: MOP, methoxypsoralen; MEs, microemulsions; HC, hydroxypropyl chitosan; CC, carboxymethyl chitosan.
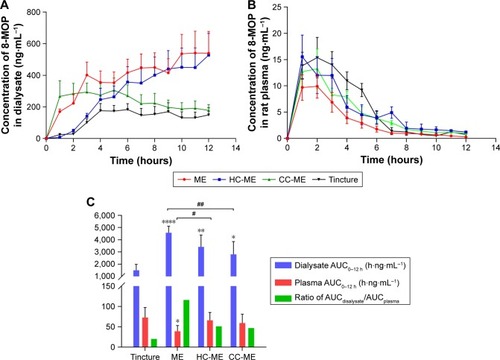
Figure S1 Valid UPLC-MS method for detecting 8-MOP in microdialysate.
Notes: (A) MS: upper, 8-MOP; lower, TMP. (B) Representative chromatography: upper, blank dialysate; lower, blank plasma. (C) Representative chromatography: upper, dialysate sample; lower, plasma sample.
Abbreviations: UPLC, ultraperformance liquid chromatography; MS, mass spectrometry; MOP, methoxypsoralen; MRM, multiple-reaction monitoring; TIC, total ion current; TMP, trimethylpsoralen; ES, electrospray.
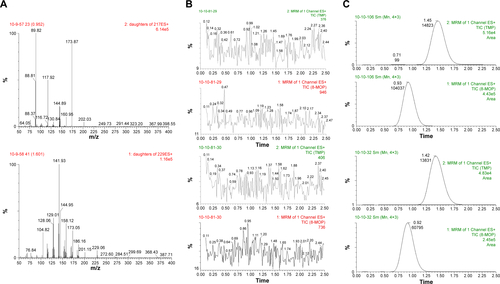
Table S1 Details of three 8-MOP ME formulations
Table S2 Preliminary stability of 8-MOP MEs, CC-MEs, and HC-MEs