
Figures & data
Figure 1 Structure and physical properties of the PGS membranes based on the GBR model of bone defects in rabbit tibia.
Notes: (A) SEM image of the cross-section of a freeze-dried 25 µm PGS membrane, 53 µm PGS membrane, and collagen membrane (Bio-Gide); scale bar, 50 µm or 200 µm. A suture pullout test (B) and tensile test (C) were performed (*p<0.05; mean ± SD; A: n=5, B: n=6, C: n=6). Compared with the control group, PGS membranes (25 µm and 53 µm) had lower mechanical strength and breaking strain. (D) Elastic modulus results are presented as mean ± SD (*p<0.05, mean ± SD, n=6). (E) Bulk densities are presented as mean ± SD (*p<0.05, **p<0.01, mean ± SD, n=6). (F, G) A permeability test was performed using PGS and Bio-Gide membranes. (H) Images of the surgical operation using the PGS membranes for the closure of tibial defects in rabbits. (I) Images of the bone sample for 25 µm PGS membranes at 4 weeks. There was a small piece of completely undegraded PGS membrane at the bone defect site.
Abbreviations: GBR, guided bone regeneration; PGS, polyglycerol sebacate; SEM, scanning electron microscopy.
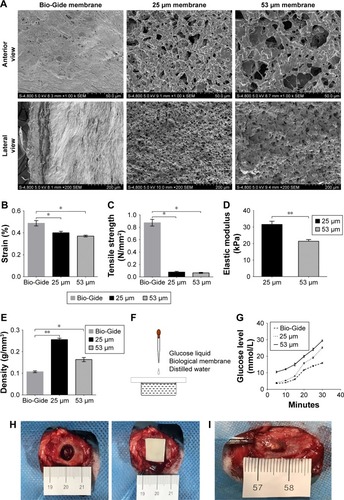
Figure 2 Micro-CT scanning images and analysis results at the end of 4 weeks.
Notes: (A) Bone defect models with or without membranes were scanned by micro-CT at 4 weeks postimplantation. In the 25 µm PGS, 53 µm PGS, and Bio-Gide membrane groups, regenerated cancellous bone covered the whole defect site after 4 weeks of implantation. (B) Volume ratios of regenerated bone were evaluated quantitatively in each group. BV/TV, Tb.Th, Tb.N, and Tb.Sp are presented as mean ± SD (*p<0.05, **p<0.01, n=16). At 4 weeks postimplantation, in the 25 µm PGS and 53 µm PGS groups, the volume ratios of newly formed bone were significantly higher than those in the Bio-Gide group and blank control group. “NS” indicates no significant difference among the PGS and Bio-Gide groups (p>0.05, mean ± SD, n=16).
Abbreviations: CT, computed tomography; PGS, polyglycerol sebacate; Tb.N, trabecular number; Tb.Sp, trabecular separation; Tb.Th, trabecular thickness; w, week; BV/TV, bone volume to tissue volume.
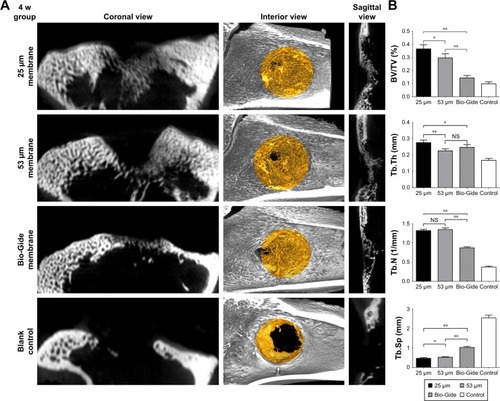
Figure 3 Micro-CT scanning images and analysis results at the end of 12 weeks.
Notes: (A) Bone defect models with or without membranes were scanned by micro-CT at 12 weeks postimplantation. In the 25 µm PGS, 53 µm PGS, and Bio-Gide membrane groups, regenerated mature lamellar bone covered the whole defect site after 12 weeks of implantation. (B) Volume ratios of regenerated bone were evaluated quantitatively in each group. BV/TV, Tb.Th, Tb.N, and Tb.Sp are presented as mean ± SD (*p<0.05, **p<0.01, n=16). At 12 weeks postimplantation, in the 25 µm PGS group, the volume ratio of newly formed bone was significantly higher than those in the 53 µm PGS group, Bio-Gide, and blank control groups. “NS” indicates no significant difference among the 53 µm PGS group and the Bio-Gide group (p>0.05, mean ± SD, n=16).
Abbreviations: CT, computed tomography; PGS, polyglycerol sebacate; Tb.N, trabecular number; Tb.Sp, trabecular separation; Tb.Th, trabecular thickness; w, week.
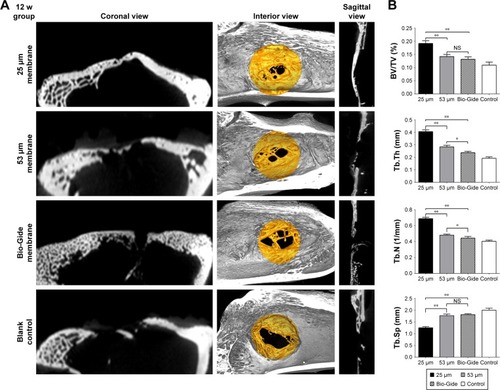
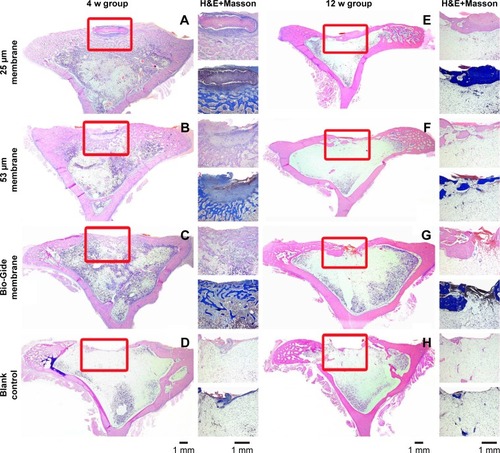
Figure 4 Histological analysis results at the end of 4 and 12 weeks. H&E-stained images of regenerated bone at 4 weeks (A–D) and 12 weeks (E–H) after membrane implantation. The entire images (left) and magnified images (right) were separated on both sides. The boxed areas in the images on the left show the lateral margin and central region of the rabbit tibia defect beneath the membranes. The images on the right show H&E staining and Masson’s trichrome staining. In the tested membrane group, the transition of newly formed bone from cancellous bone to mature lamellar bone structure was observed.
Abbreviation: w, week.
Data availability statement
The datasets generated and analyzed during the current study are available from the corresponding author on reasonable request.