Figures & data
Figure 1 Characterization of synthesized gold nanostars (GNS) probes. (A) Transmission electron microscopy (TEM) imaging of GNS nanoprobe. The scale bar is 50 nm (B) Vis-NIR extinction spectrum of 0.1 nM GNS solution in water. The plasmonic peak is at 860 nm. (C) GNS nanoparticle size distribution measured by nanoparticle tracking analysis (NTA). The mean particle hydrodynamic size is 65 nm.
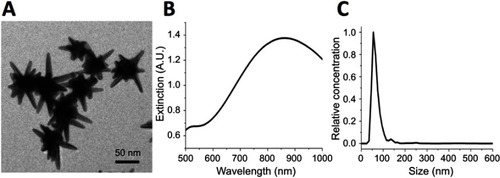
Figure 2 Immune cells loading with GNS nanoprobes. TPL imaging for dendritic cells (DC), myeloid-derived suppressor cells (MDSC) and macrophage cells after 2 h or 16 h incubation with TAT-functionalized GNS. Blue, DAPI stained cell nucleus. White, GNS. Scale bar is 100 μm and 10 μm (zoom in).
Abbreviations: GNS, gold nanostars; TPL, two-photon photoluminescence; TAT, transactivator of transcription.
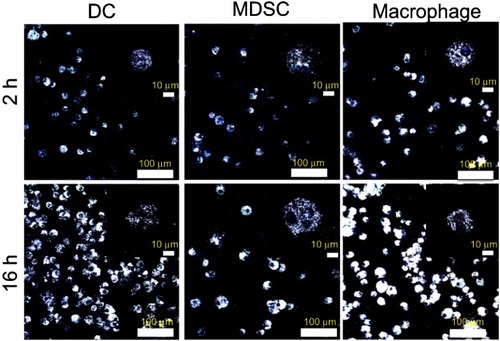
Figure 3 Cell vitality tests after GNS loading. MDSCs, DCs, and macrophages were incubated with or without TAT-GNS for 2 h or 16 h, respectively. Cells were then washed, stained for vitality markers, and detected by flow cytometry. (A, C, E) Representative plots for vitality staining of MDSC, DC, macrophages, respectively, after 2 h culture. (B, D, F) Quantification of AnnexinV- 7AAD- live cells for MDSC, DC, macrophages, respectively, after 2 h or 16 h culture. n=5. * p<0.05; ** p<0.01; **** p<0.0001.
Abbreviations: GNS, gold nanostars; MDSC, myeloid-derived suppressor cells; TAT, transactivator of transcription; DC, dendritic cells; ns, no significance.
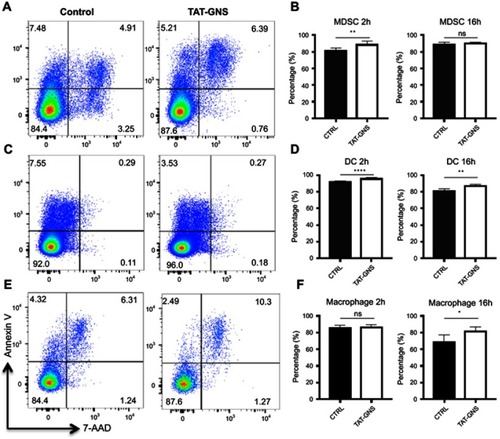
Figure 4 Macrophage cells biodistribution after systemic administration. Quantitative biodistribution of GNS-labeled macrophage cells 4 h, 24 h, and 120 h after tail vein injection and analyzed by ICP-MS method. Error bars shows standard deviation (n=4). Liver, spleen, and lung are three major organs with macrophage cells uptake. The tumor has minimal macrophage cells accumulation. % ID/g is defined as the percentage injected dose per gram tissue.
Abbreviations: ICP-MS, inductively coupled plasma mass spectrometry; GNS, gold nanostars.
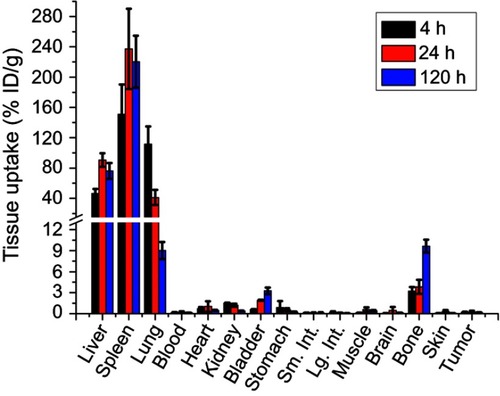
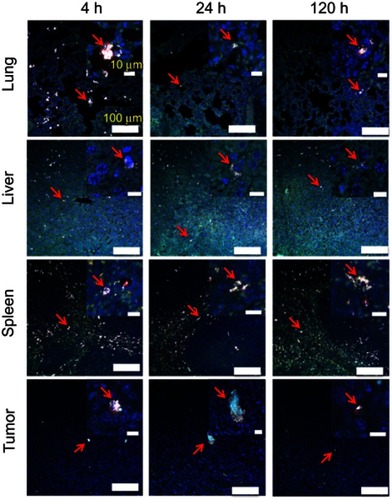
Figure 5 Macrophage cell tracking with GNS. TPL imaging of DAPI stained tissue section 4 h, 24 h or 120 h after the systematic administration of GNS-loaded macrophage cells into mice with E.G7 tumor. The red arrow shows GNS-loaded macrophage cells. GNS nanoparticles are shown as white spots under TPL. Scale bar is 100 μm and 10 μm (zoom in).
Abbreviations: GNS, gold nanostars; TPL, two-photon photoluminescence.