Figures & data
Figure 1 The in vitro studies of TiO2 NPs.
Notes: Effect of TiO2 NPs on cell viability (A), enzyme activity, ROS generation, GSH levels, and apoptosis rate in Caco-2 cells (B) and HepG2 cells (C) after 24 hours (n=3). Values were expressed as mean ± SD. *P<0.05, #P<0.01, and ŦP<0.001 as compared to control. Apoptosis rates at the concentrations <150 µg/mL TiO2 NPs were not significant compared to control.
Abbreviations: ALT, alanine aminotransferase; AST, aspartate aminotransferase; GSH, glutathione; LDH, lactate dehydrogenase; TiO2 NPs, titanium dioxide nanoparticles.
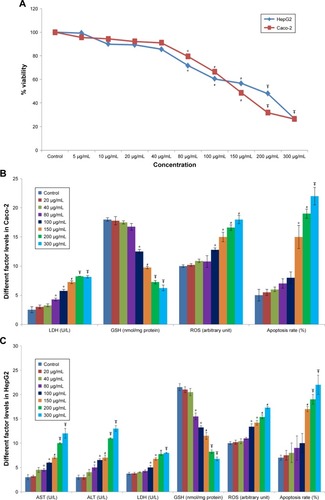
Table 1 Comparison of biochemical factors in the serum of different treated animals
Figure 2 Effect of TiO2 NPs on antioxidant gene expressions and apoptosis pathway.
Notes: Treatment of rats with TiO2 NPs significantly reduced antioxidant gene expressions and induced apoptosis pathway in the intestine (A) and liver (B) of different treated groups. Values were expressed as mean ± SD. *P<0.05, #P<0.01, and ŦP<0.001 as compared to the control group. £P<0.05 as compared to the “Control +10 mg/kg NPs” group and §P<0.05 as compared to the “Control +50 mg/kg NPs” group.
Abbreviations: CAT, catalase; GPx, glutathione peroxidase; SOD, superoxide dismutase; TiO2 NPs, titanium dioxide nanoparticles.
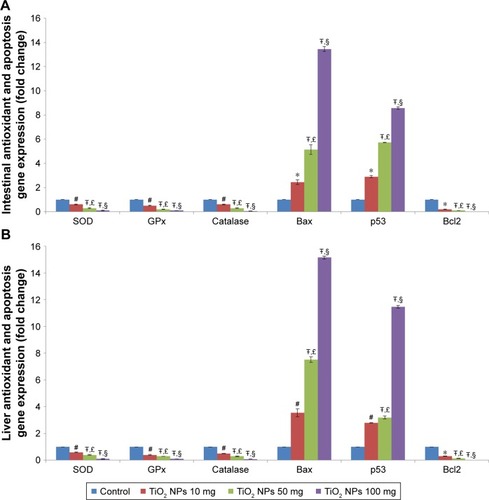
Table 2 Effects of TiO2 NPs on antioxidant enzyme activities, antioxidant capacity, lipid peroxidation, and caspase activity in the liver and intestine of different treated animals
Table 3 Intestinal and liver histopathological changes in different treated animals
Figure 3 Apoptosis determined in the intestine and liver by TUNEL.
Notes: Analysis of apoptosis by TUNEL staining of intestine (A) and liver (B) compared to control rats (magnification, 400×). Counter staining was done using DAPI nuclear staining, and pictures were taken using DAPI (i), fluorescein isothiocyanate (apoptotic cells; ii), and merged (iii) filters. Intestine and liver apoptosis were quantified by counting the number of apoptotic cells (C). Values were expressed as mean ± SD. *P<0.05, and ŦP<0.001 as compared to the control group. £P<0.05 as compared to the “Control +10 mg/kg NPs” group and §P<0.05 as compared to the “Control +50 mg/kg NPs”.
Abbreviation: TiO2 NPs, titanium dioxide nanoparticles.
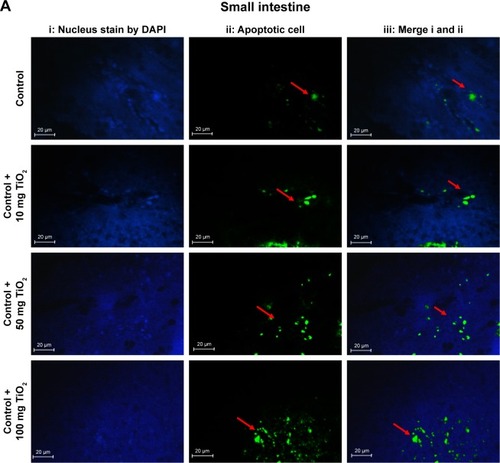
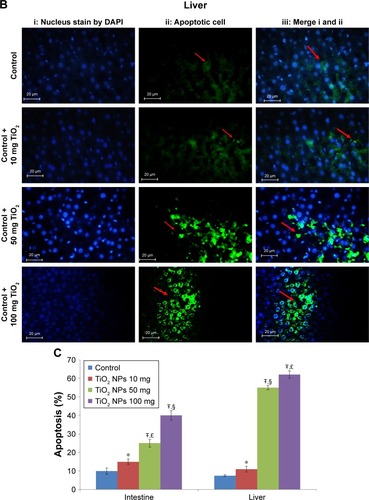
Figure 4 Effect of TiO2 NPs on inflammasome and inflammatory pathways.
Notes: Treatment of rats with TiO2 NPs significantly increased inflammasome and inflammatory gene expressions in the intestine (A) and liver (B), and the IL-1β protein, TNF-α protein, and nitric oxide levels in the intestine (C) and liver (D). Values were expressed as mean ± SD. *P<0.05, #P<0.01, and ŦP<0.001 as compared to the control group. £P<0.05 as compared to the “Control +10 mg/kg NPs” group and §P<0.05 as compared to the “Control +50 mg/kg NPs”.
Abbreviations: iNOS, inducible nitric oxide synthase; NLRP3, NLR family pyrin domain containing 3; TiO2 NPs, titanium dioxide nanoparticles; TNF-α, tumor necrosis factor-α.
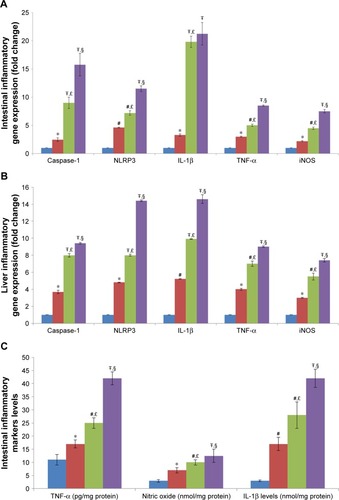
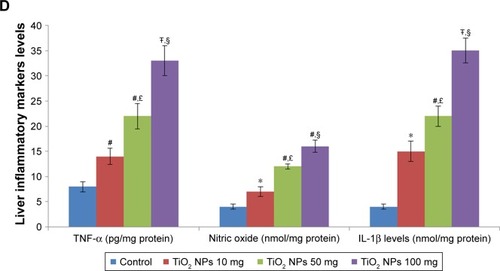
Figure 5 Morphological alteration of intestine.
Notes: Effects of TiO2 NPs on histological changes of intestine determined by H&E (A), and MT staining (B) (magnification, 400×). Results showed that in TiO2 NP-treated groups crypt structure is injured and mucosa is eroded. Moreover, edema, necrosis, disruption, shortening, and loosening of intestinal villi are present. Arrow indicates collagen deposition and straight line shows villi altitude.
Abbreviations: MT, Masson’s trichrome; TiO2 NPs, titanium dioxide nanoparticles; H&E, Hematoxylin and Eosin.
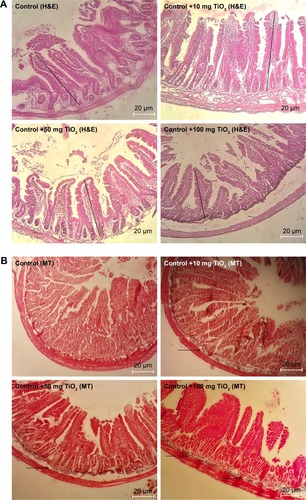
Figure 6 Morphological alteration of liver.
Notes: Effects of TiO2 NPs on histological changes of liver determined by H&E (A) and MT staining (B) (magnification, 400×). Arrow indicates collagen deposition and straight line shows central vein diameter.
Abbreviations: MT, Masson’s trichrome; TiO2 NPs, titanium dioxide nanoparticles; H&E, Hematoxylin and Eosin.
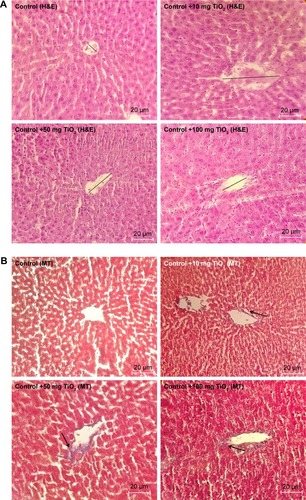
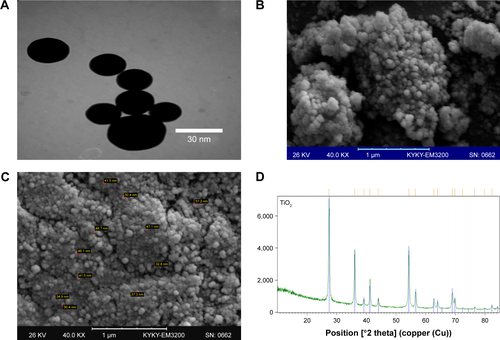
Figure S1 Characterization of TiO2 NPs.
Note: SEM (A), TEM image (B and C), and XRD pattern (D) of TiO2 NPs.
Abbreviations: SEM, scanning electron microscopy; TEM, transmission electron microscopy; TiO2 NPs, titanium dioxide nanoparticles; XRD, X-ray diffraction.