Figures & data
Table 1 Formulation details of SPC/SDC and SPC/Chol liposomes for in vitro release and in vivo bioavailability studies (n = 3)
Figure 1 The effects of homogenization factors on particle size and PI of CyA-loaded SPC/SDC liposomes. Typical size distribution of CyA-loaded SPC/SDC liposomes before (A) or after (B) homogenization is shown. Particle size and PI with different factors including homogenization pressure (▴▴P < 0.01 comparing PI at 100 and 150 bar; ▴▴▴P < 0.001 comparing PI at 100 and 150 bar) (C) and homogenization cycles (D) are shown. Data are presented as mean ± SD (n = 3).
Abbreviations: Chol, cholesterol; CyA, cyclosporine A; PI, polydispersity index; SPC, soybean phosphatidylcholine; SDC, sodium deoxycholate.
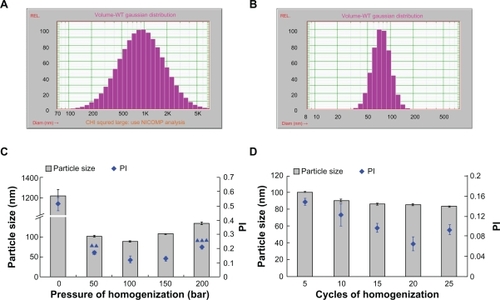
Figure 2 Effect of formulation variables on the particle size and PI of CyA-loaded SPC/SDC liposomes. Ratio of SPC/SDC (A) (***P < 0.001 comparing particle size in each of the two groups; ***P < 0.001 comparing PI at the ratio of 3/1 and 4/1); concentration of SPC (B) (**P < 0.01 comparing particle size in each of the two groups; ▴P < 0.05 comparing PI in each of the two groups.); CyA loading (C) (**P < 0.01 comparing particle size in each of the two groups; ▴▴▴P < 0.001 comparing PI in each of the two groups). Data are presented as mean ± SD (n = 3).
Abbreviations: Chol, cholesterol; CyA, cyclosporine A; PI, polydispersity index; SPC, soybean phosphatidylcholine; SDC, sodium deoxycholate.
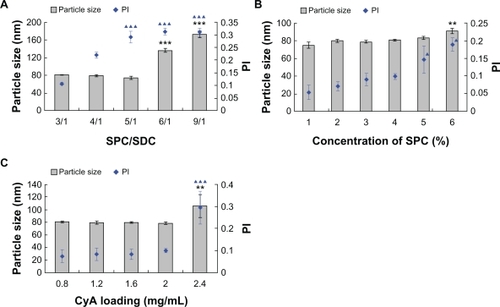
Figure 3 Effect of formulation variables on the entrapment efficiency of CyA-loaded SPC/SDC liposomes. SPC/Chol (A) (*P < 0.05 comparing SPC/Chol ratio 3/1 and 4/1); concentration of SPC (B) (*P < 0.05 comparing SPC concentration 1% and 2%; **P < 0.01 comparing SPC concentration 1% and 2%); CyA loading (C) (**P < 0.01 comparing any other group). Data are presented as mean ± SD (n = 3).
Abbreviations: Chol, cholesterol; CyA, cyclosporine A; PI, polydispersity index; SPC, soybean phosphatidylcholine; SDC, sodium deoxycholate.
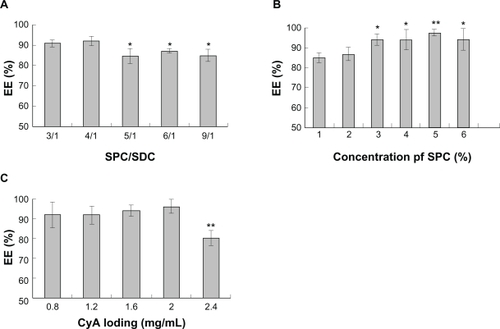
Table 2 The stability of SPC/SDC liposomes for 7 days stored in 4°C (n = 3)
Figure 4 TEM morphology of CyA-loaded SPC/SDC liposomes.
Abbreviations: CyA, cyclosporine A; SPC, soybean phosphatidylcholine; SDC, sodium deoxycholate.
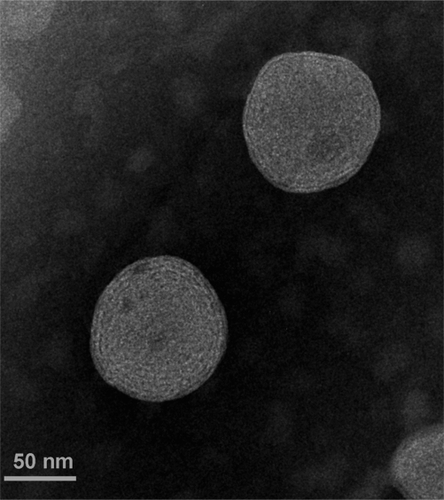
Figure 5 In vitro release of CyA from SPC/SDC, SPC/Chol liposomes, and Sandimmune Neoral. Data are presented as mean ± SD (n = 3).
Abbreviations: Chol, cholesterol; CyA, cyclosporine A; SPC, soybean phosphatidylcholine; SDC, sodium deoxycholate.
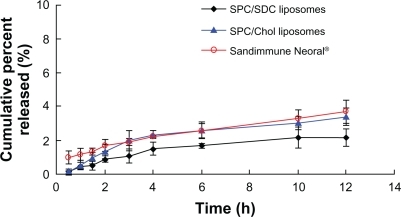
Table 3 Pharmacokinetic parameters after oral administration of CyA-loaded SPC/SDC, SPC/Chol liposomes and Sandimmune Neoral (n = 6)
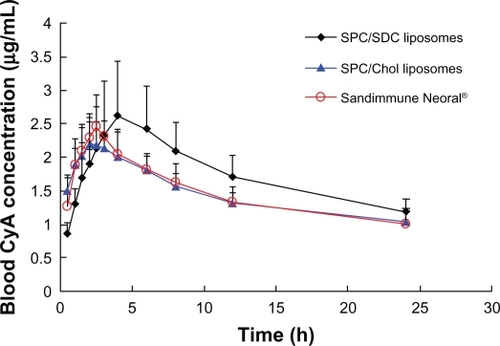
Figure 6 Plot of blood CyA concentration versus time after a single oral dose of 15 mg/kg equivalent SPC/SDC, SPC/Chol liposomes and Sandimmune Neoral in rats. Data are presented in mean ± SD (n = 6).
Abbreviations: Chol, cholesterol; CyA, cyclosporine A; SPC, soybean phosphatidylcholine; SDC, sodium deoxycholate.