Figures & data
Table 1 Experimental parameters used in the synthesis of colloidal AuNPs and Ag/AuNPs
Figure 1 FT-IR spectra of samples (a) AuNPs, (b) Ag/AuNPs and (c) pure starch.
Abbreviations: AgNPs, silver nanoparticles; AuNPs, gold nanoparticles; FT-IR, Fourier transform infrared.
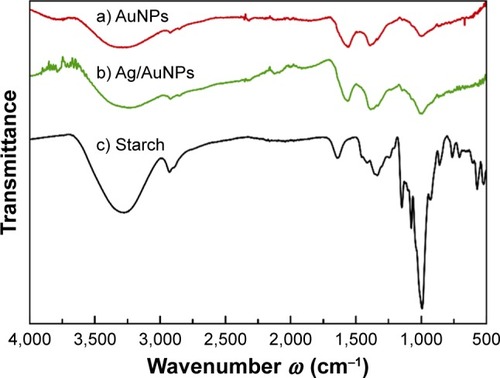
Table 2 Summary of particle size of the noble metal NP systems determined by DLS, TEM, UV–visible spectroscopy and XRD
Figure 2 Comparison of the normalized UV–visible absorption spectra for colloidal AgNPs (blue/dot), Ag/AuNPs (green/square), AuNPs (red/diamond) and a physical mixture of colloidal AgNPs and AuNPs at a ratio 1:1 v/v. Inset: Photograph of the metallic NP colloids.
Abbreviations: AgNPs, silver nanoparticles; AuNPs, gold nanoparticles; NP, nano-particle; UV, ultraviolet.
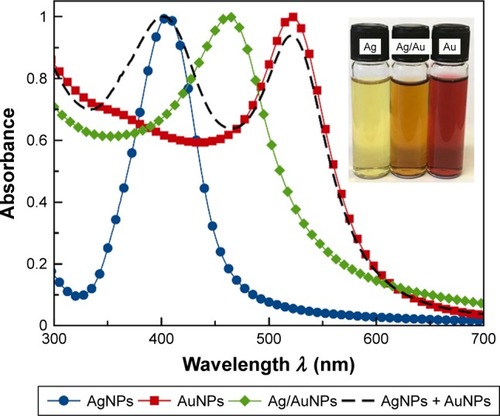
Figure 3 Normalized UV–visible absorption spectra for colloidal (A) Ag/AuNPs and (B) AuNPs showing the average and SD for λmax of each colloidal system.
Abbreviations: AgNPs, silver nanoparticles; AuNPs, gold nanoparticles; rep., repetition; UV, ultraviolet.
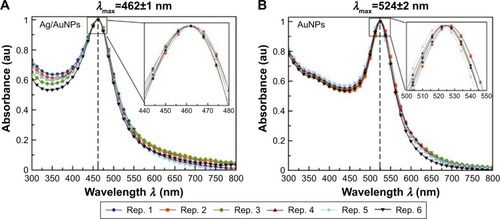
Table 3 Cubic lattice parameter (a) and crystallite size (L) for Ag/AuNPs and AuNPs, as calculated from experimental XRD patterns
Figure 4 Comparison between the experimental XRD patterns for (a) AuNPs and (b) Ag/AuNPs and the calculated XRD patterns for bulk FCC (c) Ag and (d) Au.Citation56
Abbreviations: AgNPs, silver nanoparticles; AuNPs, gold nanoparticles; FCC, face-centered cubic; XRD, X-ray diffraction.
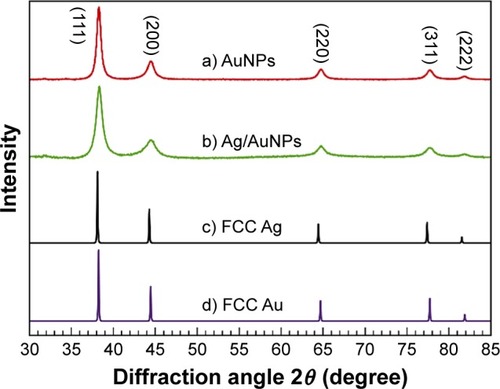
Figure 5 (A) Hydrodynamic diameter distribution obtained by DLS and (B) ζ-potential values. Both measurements were carried out at 25°C.
Abbreviations: AgNPs, silver nanoparticles; AuNPs, gold nanoparticles; DLS, dynamic light scattering.
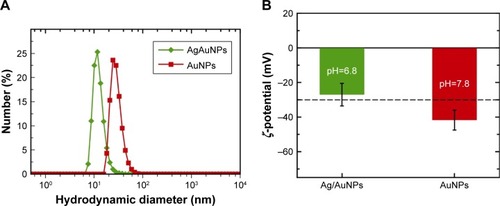
Figure 6 STEM images and particle size distribution for (A) Ag/AuNPs and (B) AuNPs. Insets: HRTEM images. The red lines in the HRTEM image in (B) show the twin planes in the Au nanocrystals.
Abbreviations: AgNPs, silver nanoparticles; AuNPs, gold nanoparticles; Dmean, mean particle size; HRTEM, high-resolution transmission electron microscopy; STEM, scanning transmission electron microscopy.
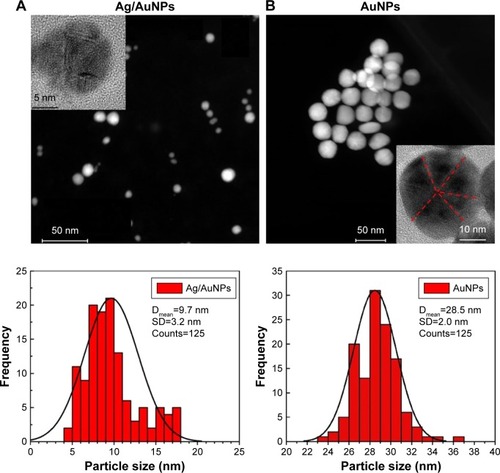
Figure 7 AuNPs (A, B) and Ag/AuNPs (C, D) decrease the growth of MDR E. coli and MRSA. Growth of a 106 CFU/mL suspension of both bacterial strains over 24 hours in the presence of different concentrations of mono- and bimetallic NPs. The values represent the mean ± SD, data = mean ± SD, N=3.
Abbreviations: AgNPs, silver nanoparticles; AuNPs, gold nanoparticles; CFU, colony-forming unit; MDR E. coli, multidrug-resistant Escherichia coli; MRSA, methicillin-resistant Staphylococcus aureus; NP, nanoparticle.
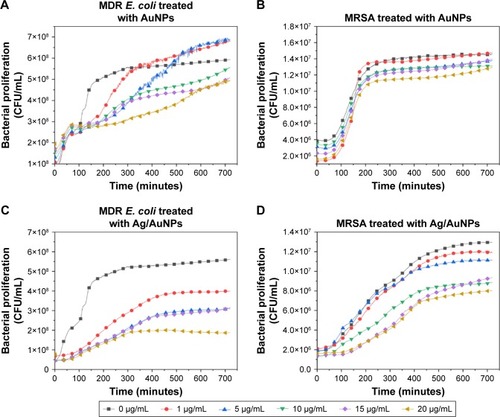
Figure 8 Modified Gompertz equation parameters A (A, B), µ (C, D) and λ (E, F) for increasing concentrations of NPs. Growth of a 106 CFU/mL suspension of MDR E. coli and MRSA over 24 hours in the presence of different concentrations of NPs. The values represent the mean ± SD, data = mean ± SD, N=3.
Abbreviations: AgNPs, silver nanoparticles; AuNPs, gold nanoparticles; CFU, colony-forming unit; MDR E. coli, multidrug-resistant Escherichia coli; MRSA, methicillin-resistant Staphylococcus aureus; NP, nanoparticle.
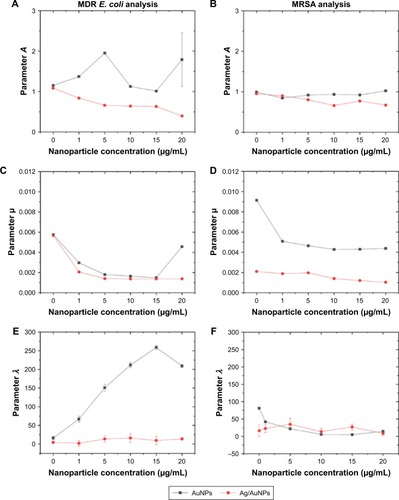
Figure 9 Colony-counting assay of MDR E. coli (A, C) and MRSA (B, D) after being treated for 8 hours with monometallic AuNPs and bimetallic Ag/AuNPs. Data = mean ± SD, N=3. *p<0.1 versus control (0 µg/mL concentration), **p<0.05 versus control (0 µg/mL concentration) and ***p<0.0005 versus control (0 µg/mL concentration). Statistical analysis performed was based on a t-distribution.
Abbreviations: AgNPs, silver nanoparticles; AuNPs, gold nanoparticles; CFU, colony-forming unit; MDR E. coli, multidrug-resistant Escherichia coli; MRSA, methicillin-resistant Staphylococcus aureus.
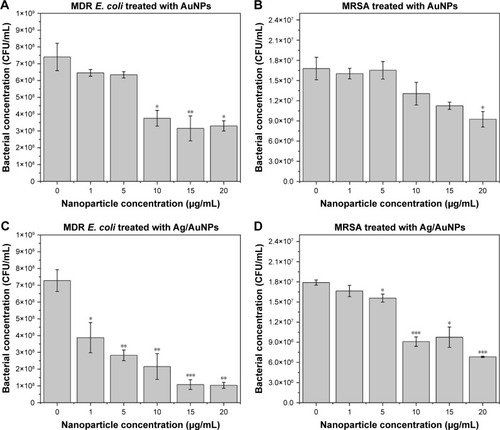
Table 4 IC50 values for different noble metal NPs against MDR E. coli and MRSA
Figure 10 SEM micrographs of MDR E. coli and MRSA cells after 8 hours of treatment with AuNPs (A, C) and Ag/AuNPs (B, D), respectively.
Abbreviations: AgNPs, silver nanoparticles; AuNPs, gold nanoparticles; MDR E. coli, multidrug-resistant Escherichia coli; MRSA, methicillin-resistant Staphylococcus aureus; SEM, scanning electron microscopy.
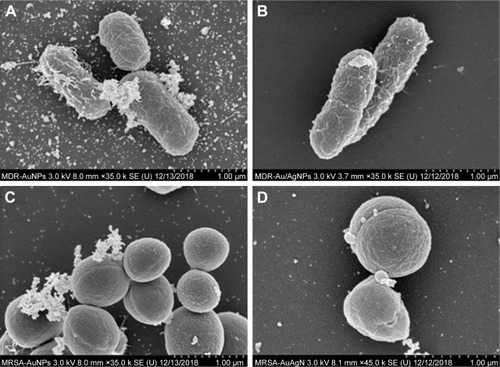
Figure 11 MTS assay on HDF cells in the presence of AuNPs (A) and Ag/AuNPs (B) at concentrations ranging from 1 to 20 µg/mL. Data = mean ± SD, N=3. *p<0.01 versus control (0 µg/mL concentration), Statistical analysis performed was based on a t-distribution.
Abbreviations: AgNPs, silver nanoparticles; AuNPs, gold nanoparticles; HDF, human dermal fibroblast.
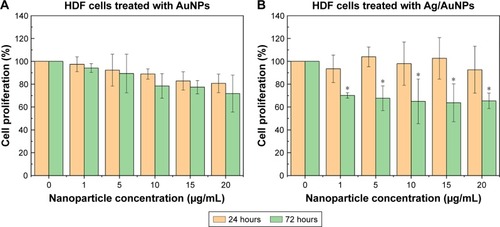
Figure 12 MTS assay on melanoma cells in the presence of AuNPs (A) and Ag/AuNPs (B) at concentrations ranging from 1 to 20 µg/mL. Data = mean ± SD, N=3. *p<0.01 versus control (0 µg/mL concentration), **p<0.005 versus control (0 µg/mL concentration). Statistical analysis performed was based on a t-distribution.
Abbreviations: AgNPs, silver nanoparticles; AuNPs, gold nanoparticles.
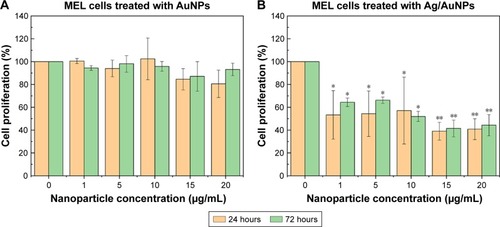
Figure S1 Normalized UV–visible absorption spectra for colloidal AgNPs showing the average and SD for λmax. The AgNPs were synthesized by mixing 250 µL of an aqueous solution 25 mM AgNO3 with 500 µL of 1% starch solution at pH=11. The reaction time was set to 2 hours at 70°C.
Abbreviations: AgNPs, silver nanoparticles; rep., repetition; UV, ultraviolet.
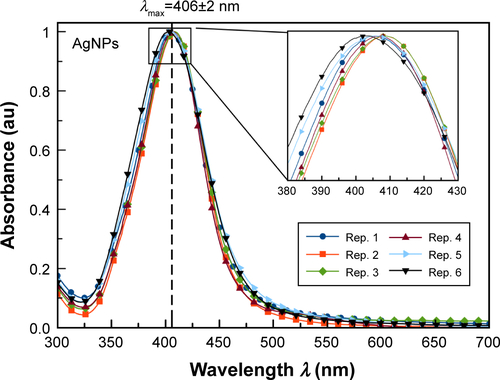
Figure S2 Non-normalized UV–visible absorption spectra (left figures) and shift of λmax and absorbance at the given λmax as a function of time (right figures) for colloidal (A) Ag/AuNPs and (B) AuNPs showing the stability of the samples over time.
Abbreviations: Abs@λmax, absorbance at the corresponding λmax; AgNPs, silver nanoparticles; AuNPs, gold nanoparticles; UV, ultraviolet.
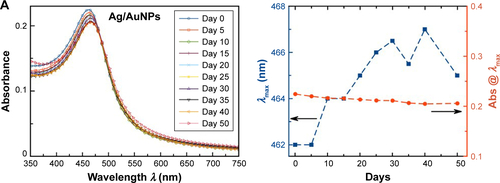
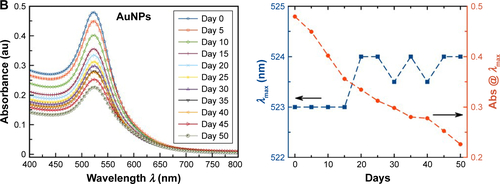
Figure S3 STEM image and EDS spectrum of the Ag/Au alloy NP marked with the point 1 in the STEM image. The Cu signal is due to the TEM grid. Abbreviations: at%, atomic percentage; NPs, nanoparticles; STEM, scanning transmission electron microscopy; TEM, transmission electron microscopy.
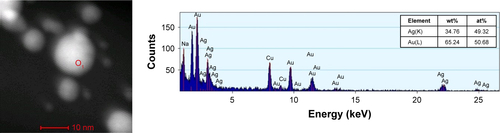
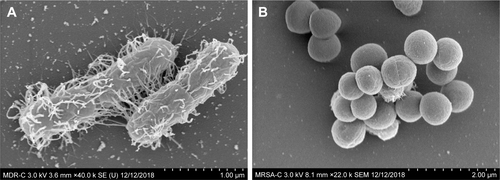
Figure S4 SEM images of untreated control samples of MDR E. coli (A) and MRSA (B).
Abbreviations: MDR E. coli, multidrug-resistant Escherichia coli; MRSA, methicillin-resistant Staphylococcus aureus; SEM, scanning electron microscopy.