Figures & data
Figure 1 The optimal values for albumin concentration (A), pH (B) and ethanol volume (C) were selected based on a particle diameter (blue lines) close to 200 nm and polydispersity index (red lines) close to 0.1. Data are shown as mean ± SEM (n=6).
Abbreviations: ANPs, albumin nanoparticles; SEM, standard error of mean.
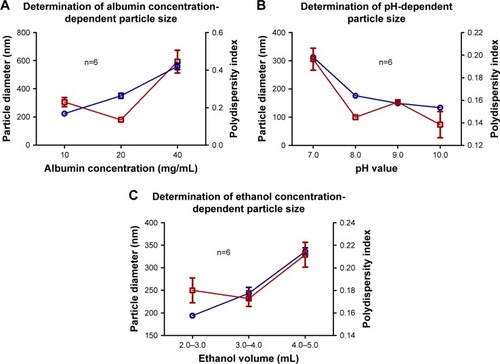
Figure 2 Encapsulation efficiency (red line) and drug loading (blue line) of ATP in ANPs at different times. Best results were obtained after 48 hours of incubation. Data are shown as mean ± SEM (n=5).
Abbreviations: ANPs, albumin nanoparticles; SEM, standard error of mean.
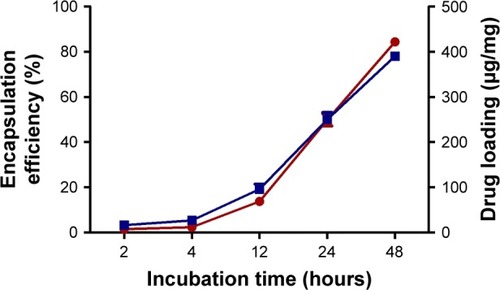
Figure 3 Stability of the EMs after heat treatment to inhibit the activity of ecto-ATPases. Deprivation of erythrocyte contents was verified by changes in the morphology. (A) Normal erythrocyte (Aa) became transparent (Ab) after hypotonic treatment. The structure of the EMs after heat treatment was observed to be stable only at 45° (Ba), but not at 50° (Bb) or 56°C (Bc). Degradation of ATP by erythrocyte ecto-ATPases of cell membrane was inhibited post-thermic treatment. (C) Significant differences were found only in the concentration of ATP from the solution incubated with EMs without heat treatment (EMs 25°C). The concentrations of ATP for EMs at 45°C and at EMs 50°C were similar to the value of the ATP solution without EMs incubation (control). Data are shown as mean ± SEM (n=4). *P-values ≤0.05.
Abbreviations: EMs, erythrocyte membranes; SEM, standard error of mean.
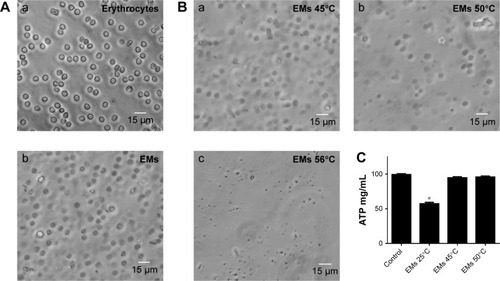
Figure 4 Shape and size of the ANPs+ATP and EM-ANPs+ATP analyzed by TEM. Nanoparticles obtained were spherical. (A) Changes were also observed on the surface of the ANPs+ATP after being coated with EMs; while the ANPs+ATP showed a smooth homogeneous surface (Aa), the EM-ANPs+ATP (Ab) presented a rough surface due to the presence of the EMs (arrows). Coating of nanoparticles was also confirmed by confocal microscopy where colocalization of the fluorescent dyes used to label ANPs and EMS was observed (B). Size distribution showed similar diameters between ANPs+ATP (Ca) and EM-ANPs+ATP(Cb) (C).
Abbreviations: ANPs+ATP, ATP-carrying albumin nanoparticles; EM, erythrocyte membranes; EM-ANPs+ATP, ATP-carrying albumin nanoparticles coated with erythrocyte membranes; SEM, standard error of mean; TEM, transmission electron microscopy.
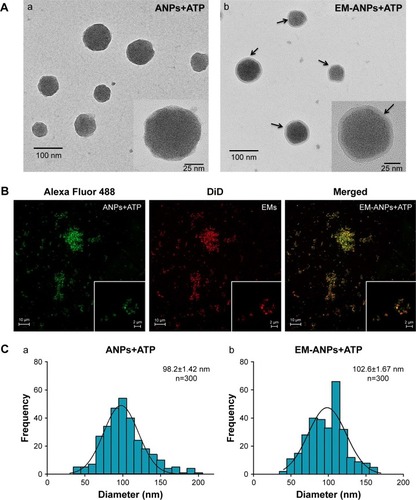
Figure 5 Characterization of hydrodynamic size of different components of the nanoparticles by DLS. Sizes were similar between ANPs, ANPs+ATP, and EM-ANPs. Data are shown as mean ± SEM (n=4).
Abbreviations: ANPs, albumin nanoparticles; ANPs+ATP, ATP-carrying albumin nanoparticles; EM, erythrocyte membranes; EM-ANPs+ATP, ATP-carrying albumin nanoparticles coated with erythrocyte membranes; DLS, dynamic light scattering; SEM, standard error of mean.
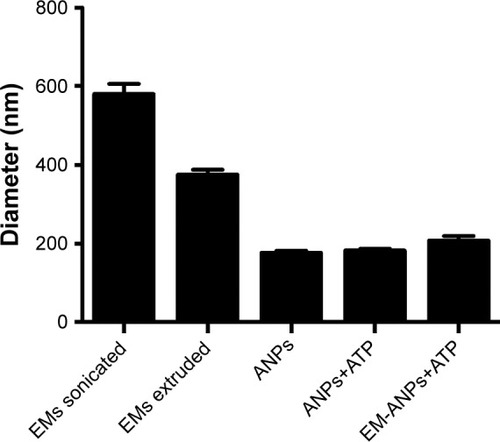
Table 1 Zeta-potential values were negative except for ANPs
Figure 6 Stability of nanoparticles was analyzed by determining the size by DLS. A significant increase in particle diameter (blue lines) was observed on days 4, 7 and 15 in water suspension vs PBS or cell culture medium suspension. Polydispersity index (red lines) increased significantly only on day 15 in water suspension. Data are shown as mean ± SEM (n=5). *P-value ≤0.05.
Abbreviations: DLS, dynamic light scattering; SEM, standard error of mean.
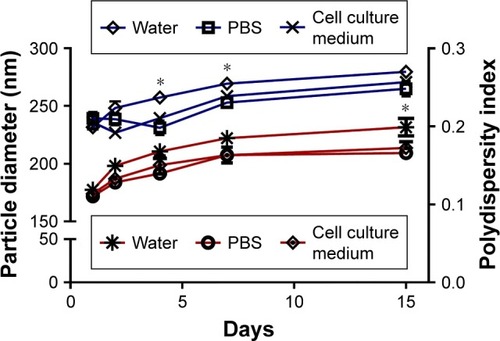
Figure 7 In vitro cumulative release of ATP from ANPs and EM-ANPs. Circles (o) represent the release from ANP; squares (■) represent the release from EM-ANPs. Data are shown as mean ± SEM (n=5).
Abbreviations: ANPs, albumin nanoparticles; ANPs+ATP, ATP-carrying albumin nanoparticles; EM-ANPs+ATP, ATP-carrying albumin nanoparticles coated with erythrocyte membranes; SEM, standard error of mean.
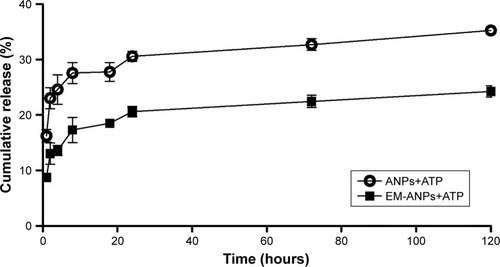
Figure 8 Nanoparticle uptake assay in HeLa and HEK-293 cells. To demonstrate that nanoparticles can be internalized into normal or cancer cells, fluorescent ANPs+ATP labeled with Alexa Fluor 488 (A) and EM-ANPs+ATP labeled with DiD (B) were prepared. Analysis by confocal microscopy revealed a lower number of internalized EM-ANPs+ATP nanoparticles in normal and cancer cells (C), suggesting a longer circulation time for these nanoparticles. A higher proportion of ANPs+ATP and EM-ANPs+ATP was observed in HeLa cells vs HEK-293 cells Data are shown as mean ± SEM (n=50), *P-value ≤0.05, ***P-value ≤0.001.
Abbreviations: ANPs+ATP, ATP-carrying albumin nanoparticles; EM-ANPs+ATP, ATP-carrying albumin nanoparticles coated with erythrocyte membranes; SEM, standard error of mean.
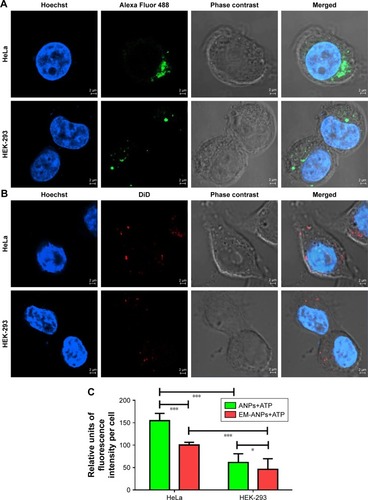
Figure 9 Effects of free or loaded ATP on HeLa cells growth. Effect of free ATP on HeLa cell viability was observed after 48 and 72 hours of treatment (A). Cells were incubated in absence or presence of different concentrations of EM-ANPs+ATP for 48 and 72 hours, and the proportion of living cells was determined by MTS assay (B). Data are shown as mean ± SEM (n=5), *P-value ≤0.05, **P-value ≤0.01, ***P-value ≤0.001.
Abbreviations: EM-ANPs+ATP, ATP-carrying albumin nanoparticles coated with erythrocyte membranes; IC50, half maximal inhibitory concentration; SEM, standard error of mean.
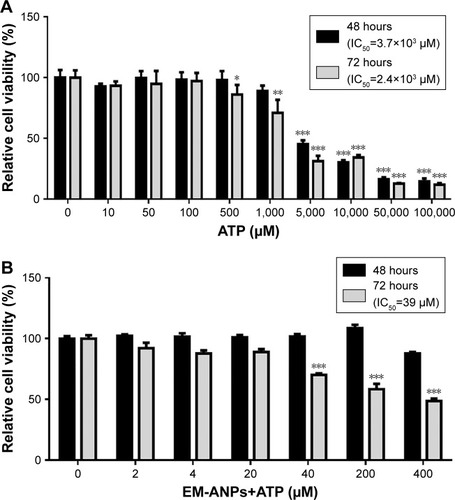
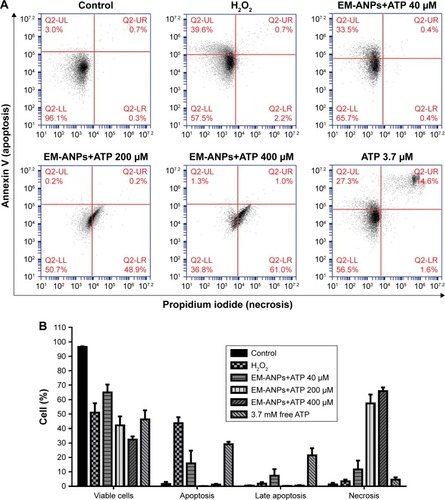
Figure 10 Analysis of apoptosis and necrosis induced by EM-ANPs+ATP by flow cytometry. HeLa cells were treated with 0, 40, 200, and 400 µM EM-ANPs+ATP, 3.7 mM of free ATP and 500 µM of H2O2 as positive control, for 72 hours. The acquisition data were divided into four quadrants according to the type of fluorescence emitted from the cells: Q2-UL calculates the percent of cells undergoing apoptosis (Annexin V), Q2-UR calculates the percent of cells undergoing late apoptosis or induced necrosis (Annexin V and propidium iodide), Q2-LL calculates the percent of cells with no fluorescence, and Q2-LR calculates the percent of cells undergoing necrosis induced by the different treatments (A). Results with EM-ANP+ATP 200 and 400 µM showed an increase in the percentage of necrotic cells compared to free ATP (B). Data are shown as mean ± SEM (n=3).
Abbreviations: EM-ANPs+ATP, ATP-carrying albumin nanoparticles coated with erythrocyte membranes; SEM, standard error of mean; EM, erythrocyte membrane.