Figures & data
Figure 1 Schematic representation of inhibitory mechanism of nano-β-TCP on hepatocellular carcinoma. Intratumor injection of nano-β-TCP was performed on the xenograft hepatocellular carcinoma model. Nano-β-TCP was internalized into tumor cells by nonspecific endocytosis and rapidly degraded in the acidic lysosome to release Ca2+ and PO43- ions (①). Cell apoptosis was activated by extrinsic and intrinsic apoptosis pathways synergistically orchestrated with the ROS generation (②). In addition, the expression of some related cyclins (CyclinD1, CDK2, CyclinE, and β-catenin) was inhibited, eventually leading to cell cycle blocking in G0/G1 phase (③).
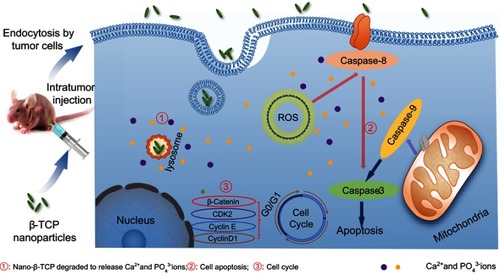
Figure 2 Characterization of nano-β-TCP synthesized by ethanol-water system. (A) XRD pattern, (B) FTIR, and (C) TEM images of nano-β-TCP. (Scale bar: 20 nm).
Abbreviations: FTIR, Fourier transform infrared spectroscopy; TEM, transmission electron microscopy; XRD, X-ray diffraction.
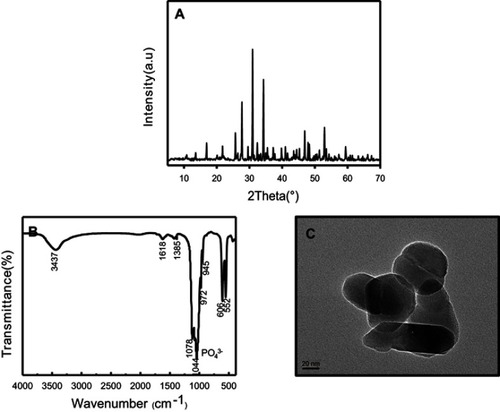
Figure 3 (A) Comparison of the cell viabilities of HepG2 and L-02 cells treated with different concentrations of nano-β-TCP for 24 and 48 hours. (B) The relative increased intracellular content of CaCitation2+ and PO43- ions in L-02 and HepG2 cells treated with nano-β-TCP (400 μg/mL) for 48 hours (vs control group, *P<0.05, **P<0.01). TEM images of L-02 (C, D) and HepG2 (E, F) cultured with nano-β-TCP (400 μg/mL) for 48 h. (D and F are enlarged views of C and E in red pane, respectively).
Abbreviations: N, nucleus; M, mitochondria; L, lysosomes; the particles labelled by red arrows are nano-β-TCP.
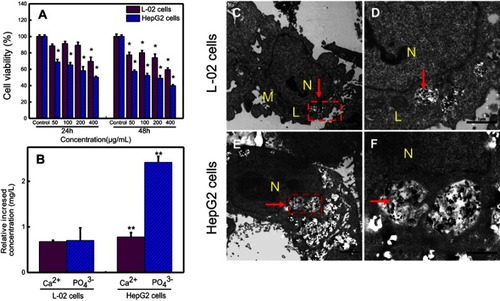
Figure 4 Fluorescent of the intracellular ROS using DCFDA dye in L-02 (A–C) and HepG2 (D–F) cells for 48 hours. (A) and (D) Control group, (B) and (E) Treated with Rosup, (C) and (F) Treated with nano-β-TCP. (G) The intracellular ROS level in both cell types for 48 hours (vs control group, *P<0.05).
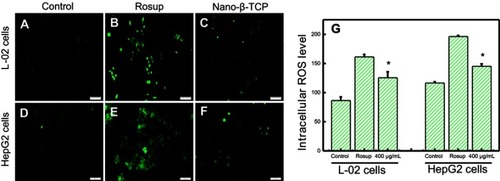
Figure 5 The effects of nano-β-TCP on cell cycle (A–D) and cell apoptosis (E–H) for 48 hours. (A and E: L-02+0 μg/mL; B and F: L-02+400 μg/mL;C and G: HepG2+0 μg/mL, D and H: HepG2+0 μg/mL).
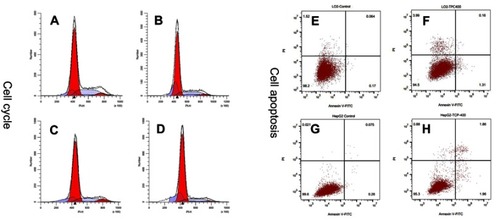
Table 1 Effects of nano-β-TCP on cyclins (CyclinD1, CDK2, CyclinE, β-catenin) and apoptosis indexes (BAX, Caspase-3, 8, and 9)in L-02 and HepG2 cells
Figure 6 (A–D) Fluorescent micrographs of cells before and after nano-β-TCP treatment for 48 hours. Cell nuclei were stained with Hochest33342. Apoptotic cells are labeled by red arrows. (E) Expression of some related cyclins (CyclinD1, CDK2, CyclinE, β-catenin) and apoptosis indexes (BAX, Caspase3, Caspase8, and Caspase9) in L-02 and HepG2 cells treated with nano-β-TCP for 48 hours. (Scale bar: 100 μm. Compared to the control group).
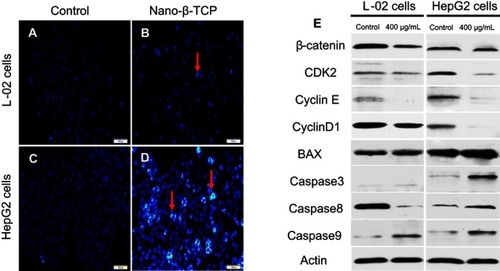
Figure 7 In vivo toxicity of nano-β-TCP. (A) The effects of nano-β-TCP with different concentrations (0, 20, 40 mg/kg) on change in body weight. (B–E) H&E staining of liver and kidney sections from nude mice treated with nano-β-TCP. (B and D) Control; (C and E) 40 mg/kg.
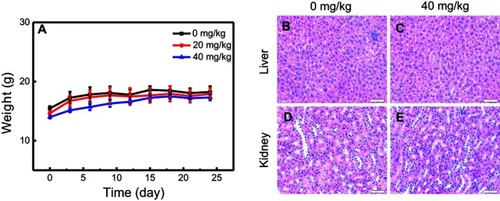
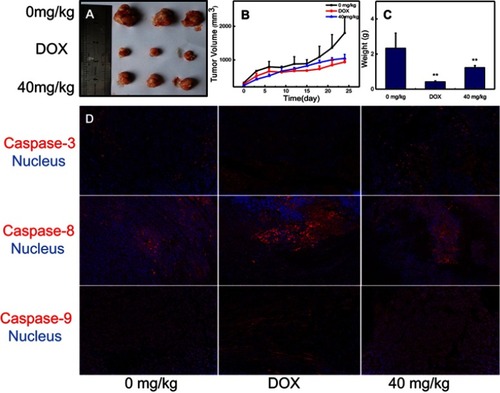
Figure 8 In vivo evaluation of antitumor activity of nano-β-TCP. (A) Tumor size; (B) Tumor volume; (C) Tumor weight; (D) Nano-β-TCP-induced tumor cell apoptosis (Caspase-3, Caspase-8, and Caspase-9), indicating that the mechanisms of nano-β-TCP-induced caspase-dependent apoptosis were also adequate for the in vivo (vs control group); **P<0.01.