Figures & data
Figure 1 Schematic diagram of preparation of irisin loaded SCS/P scaffold and its application for bone regeneration.
Abbreviations: SF, silk fibroin; CS, calcium silicate; SA, sodium alginate; SCS, silk/calcium silicate/sodium alginate; BMSCs, bone marrow stem cells; i/SCS/P, irisin-loaded silk/calcium silicate/sodium alginate/PVA composite scaffold; SCS/P, silk/calcium silicate/sodium alginate/PVA.
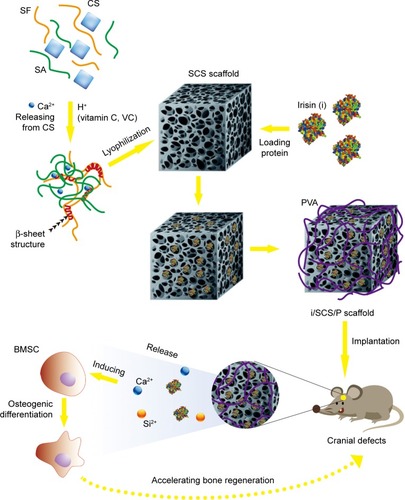
Table 1 Quantitative real-time PCR primer sets
Figure 2 Morphology and composition analysis.
Notes: SEM images of SCS (A and B) and SCS/P (C and D) scaffold. (E) Selected area on SCS and SCS/P scaffolds and the elemental distributions of C, O, Si, Ca. (F) Quantitative analysis of all the elements on the SCS scaffold surface. (G) Quantitative analysis of all the elements on the SCS/P scaffold surface.
Abbreviations: SEM, scanning electron microscopy; SCS, silk/calcium silicate/sodium alginate; SCS/P, silk/calcium silicate/sodium alginate/PVA.
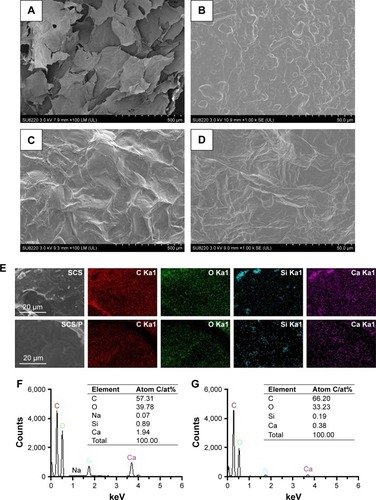
Figure 3 Physical characterizations of SCS/P composite scaffold.
Notes: (A) Swelling ratio. (B) Degradation curve in PBS. (C) Degradation curve in protease XIV solution. (D) pH value changes. (E) Compressive stress-strain curve. The dotted line stands for fitted line of function. (F) Compressive modulus and strength. *P<0.05, compared with SCS group.
Abbreviations: SCS, silk/calcium silicate/sodium alginate; SCS/P, silk/calcium silicate/sodium alginate/PVA.
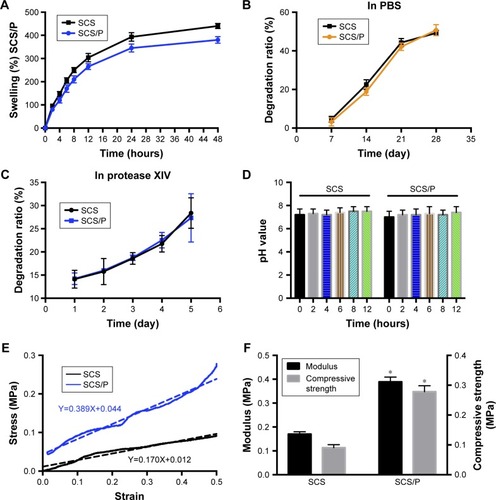
Figure 4 Bioactivity and biocompatibility of SCS/P composite scaffold.
Notes: (A) SEM image of SCS/P scaffold after immersed in SBF after 7 days. The region of interest is selected by a blue dashed outline and magnified in (B). (C) XRD spectra of SCS/P scaffold immersed in SBF after 7 days (blue line) and untreated by SBF (yellow line). (D) Cell viability and (E) the fold change of BMSCs co-cultured with SCS and SCS/P composite scaffolds. Cells cultured without SCS or SCS/P composite scaffolds were used as control (CON). *P<0.05, compared with the corresponding data at day 1. Abbreviations: SCS/P, silk/calcium silicate/sodium alginate/PVA; SBF, simulated body fluid; CS, calcium silicate; HA, hydroxyapatite; CON, control; SCS, silk/calcium silicate/sodium alginate; SEM, scanning electron microscopy; BMSCs, bone marrow stem cells.
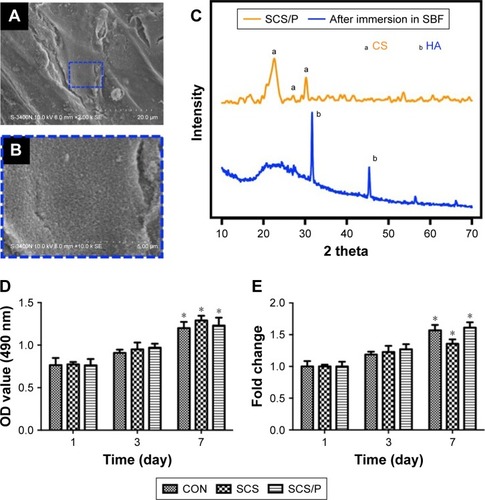
Figure 5 Bioactive release of irisin from i/SCS/P scaffold.
Notes: (A) Release kinetics of irisin from i/SCS/P. Effect of different concentrations of irisin on BMSCs proliferation was detected by CCK-8 and analyzed in OD values (B) and fold changes (C) compared to the corresponding control group. At each scheduled time, BMSCs cultured in standard medium without irisin were taken as control. (D) ALP activity assay. The i/SCS/P scaffold was immersed in culture medium for 4 hours, 12 hours, and 7 days, respectively. The extracts at different times were used to culture BMSCs for 3 days and then treated with ALP activity assay. Culture medium with a same concentration of irisin, corresponding to what was calculated in the extract, was used as positive control. *P<0.05, compared with the corresponding positive control group. **P<0.05, compared with the 4 hours and 12 hours collected medium. (E) ALP staining at 7 days and (F) ARS staining at 28 days. BMSCs were cultured with the different extracts of i/SCS/P. BMSCs cultured with the extracts of SCS/P scaffolds were used as control. Lower magnification images (scale bar: 1 mm) are shown in the upper panel. The region of interest is selected by a red or yellow box and magnified with higher magnification (scale bar: 500 µm) in the lower panel.
Abbreviations: CON, control; I, irisin; i/SCS/P, irisin-loaded silk/calcium silicate/sodium alginate/PVA; BMSCs, bone marrow stem cells; CCK-8, cell counting kit-8; ALP, alkaline phosphatase; ARS, alizarin red S; SCS/P, silk/calcium silicate/sodium alginate/PVA.
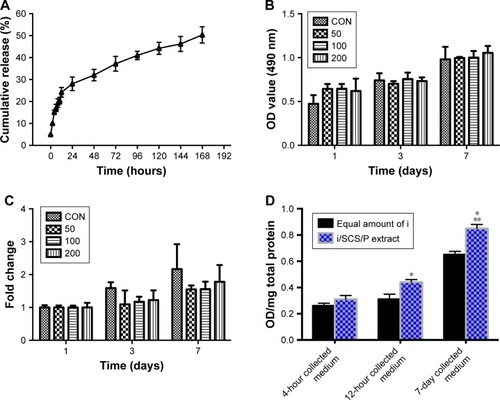
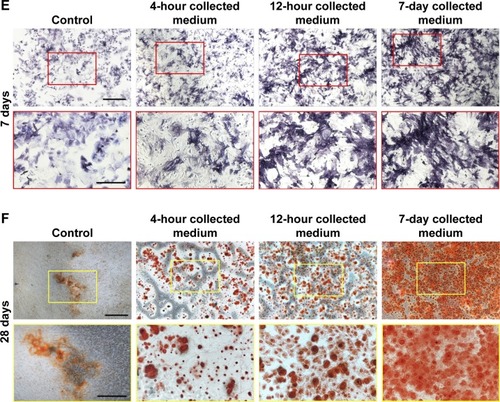
Figure 6 Relative gene expression of osteogenic markers.
Notes: BMSCs were cultured with the different extracts of i/SCS/P for 3 and 7 days, respectively. BMSCs cultured with the extracts of SCS/P scaffolds were used as control. Relative gene expressions of RUNX-2, ALP, Osterix, BMP2, OCN, and OPN were determined by PCR. *P<0.05, compared with the corresponding control group.
Abbreviations: BMSCs, bone marrow stem cells; i/SCS/P, irisin-loaded silk/calcium silicate/sodium alginate/PVA; SCS/P, silk/calcium silicate/sodium alginate/PVA.
Figure 7 Evaluation of new bone formation in calvarial defects at 8 weeks post-implantation via µCT.
Notes: (A) Representative µCT images of calvarial defects showing mineralized bone formation after treatment with no implant (blank), SCS/P scaffold (0), i/SCS/P containing 100 ng irisin (100), and i/SCS/P containing 200 ng irisin (200), respectively. The yellow circle indicates the original defect margin. Scale bar: 1 mm. Quantitative analysis of (B) the volume of the regenerated BV and (C) BMD. *P<0.05, compared with blank and 0 groups.
Abbreviations: µCT, microcomputed tomography; SCS/P, silk/calcium silicate/sodium alginate/PVA; i/SCS/P, irisin-loaded silk/calcium silicate/sodium alginate/PVA; BV, bone volume; BMD, bone mineral density.
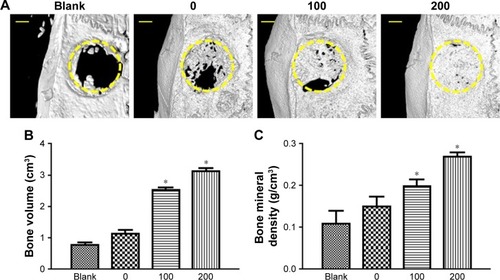
Figure 8 Histological sections stained with H&E.
Notes: Scaffolds in different groups were implanted at the calvarial defects for 8 weeks. (A) No implant. (B) SCS/P scaffold. (C) i/SCS/P containing 100 ng irisin. (D) i/SCS/P containing 200 ng irisin. The first panel images showed the whole view of the operation site. Higher magnification (×25) of the boxed area is displayed for margin of the defects (green dotted lines) and center of the defects (blue dotted lines). Black arrows represent new blood vessels and endotheliocytes.
Abbreviations: SCS/P, silk/calcium silicate/sodium alginate/PVA; i/SCS/P, irisin-loaded silk/calcium silicate/sodium alginate/PVA.
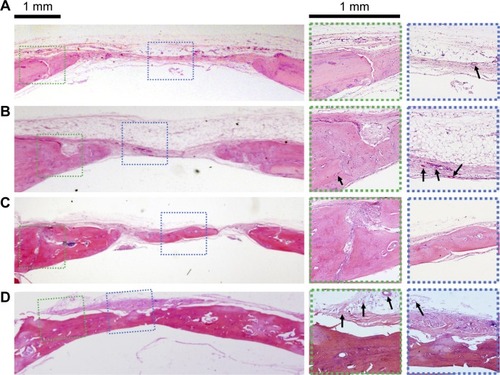
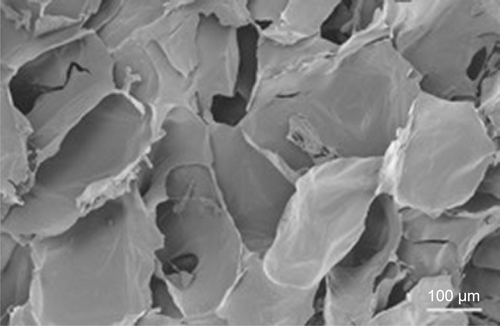
Figure S1 SEM image of cross section of the SCS/P scaffold.
Abbreviations: SEM, scanning electron microscopy; SCS/P, silk/calcium silicate/sodium alginate/PVA.