Figures & data
Figure 1 A schematic showing fabrication steps of Ti–Ag alloys with nanotubular coatings and its cellular responses as well as osseointegrative properties.
Abbreviation: NT, nanotube.
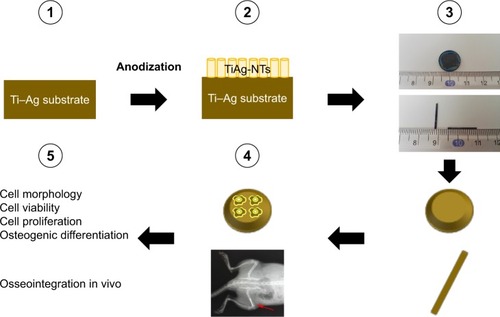
Figure 2 (A and C) Macroscopic images of Ti2%Ag-NT used in vitro and in vivo. (B and D) SEM images of nanotubes formed on the surface of Ti2%Ag-NT.
Abbreviations: NT, nanotubes; SEM, scanning electron microscope.
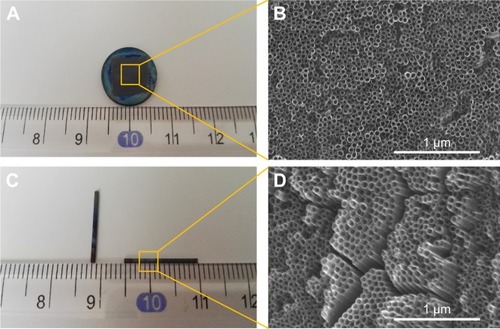
Table 1 Primers used in q-PCR
Figure 3 The right femoral condylar insertion model: an implant was inserted into a hole drilled in the intercondylar fossa (A and B); the postoperative X-ray with the sample in the right femoral condyle (C).
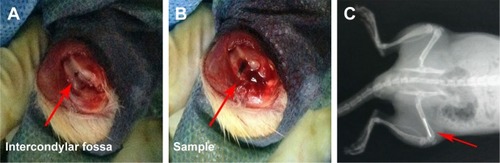
Figure 4 MG63 cell morphology of cp-Ti, TNT, and TiAg-NTs after 1 day of culture.
Note: The arrows indicate the filopodia of MG63 cells on each specimen.
Abbreviations: cp-Ti, commercially pure Ti; TNT, titanium nanotubes; NT, nanotubes.
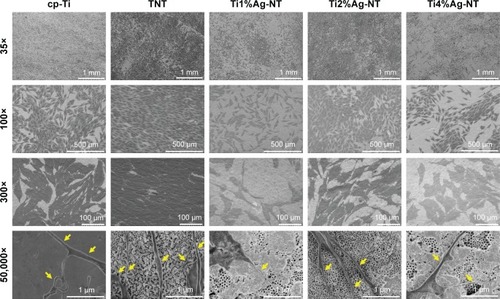
Figure 5 CLSM images of MG63 cells seeded on cp-Ti, TNT, and TiAg-NTs after 1 day of culture.
Note: Green fluorescence indicates living cells, and red fluorescence indicates dead cells.
Abbreviations: CLSM, confocal laser scanning microscope; cp-Ti, commercially pure Ti; NT, nanotubes; TNT, titanium nanotubes.
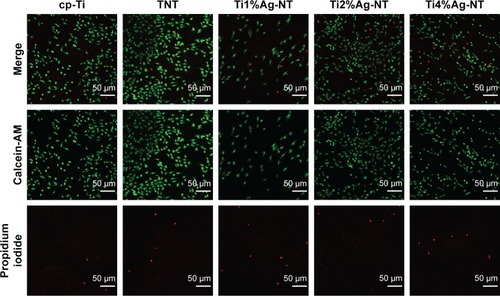
Figure 6 Histographic representations of cell cycle distribution (A–C) and the proliferation index of cells on each substrate (D) at days 1, 4, and 7.
Note: All values are reported as the mean ± SD (n=3). *P<0.05 and **P<0.01.
Abbreviations: cp-Ti, commercially pure Ti; d, days; NT, nanotubes; TNT, titanium nanotubes.
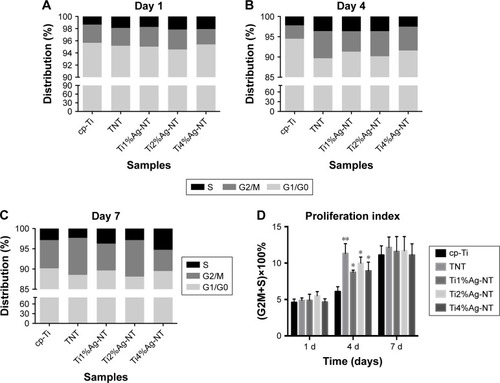
Figure 7 Relative gene expression levels of cells on each sample at days 7 and 14: (A and D) ALP, (B and E) Col-I, and (C and F) OC gene expression levels.
Notes: All values are reported as mean ± SD (n=3). Data were normalized to the β-actin mRNA expression level and converted to the fold change relative to cells on the control sample (cp-Ti). *P<0.05 and **P<0.01.
Abbreviations: Col-I, collagen-I; cp-Ti, commercially pure Ti; d, days; NT, nanotubes; OC, osteocalcin; TNT, titanium nanotubes.
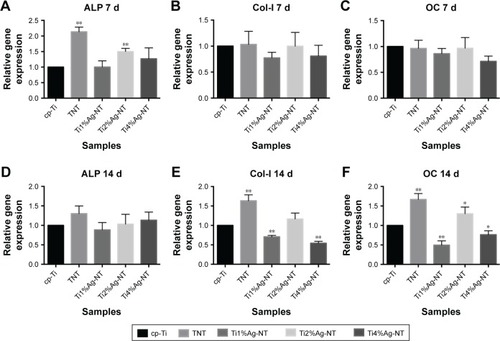
Figure 8 Western blot analysis of Col-I and OC protein expression levels at days 7 and 14: (A–C) Col-I and OC expression at day 7; (D–F) Col-I and OC expression at day 14.
Notes: Data were normalized to the β-actin protein expression level and converted to the fold change relative to cells on the control sample (cp-Ti). *P<0.05 and **P<0.01.
Abbreviations: Col-I, collagen-I; cp-Ti, commercially pure Ti; NT, nanotubes; OC, osteocalcin; TNT, titanium nanotubes.
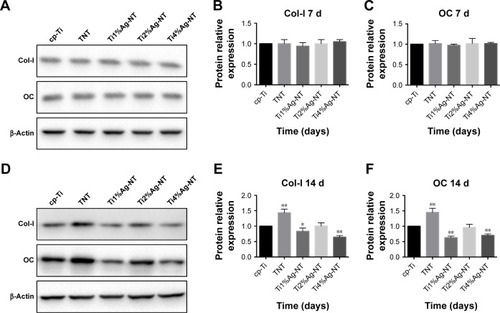
Figure 9 Representative 3D micro-CT images of the femoral condyle at 1, 2, and 4 weeks after sample implantation.
Abbreviations: cp-Ti, commercially pure Ti; NT, nanotubes; TNT, titanium nanotubes; w, weeks.
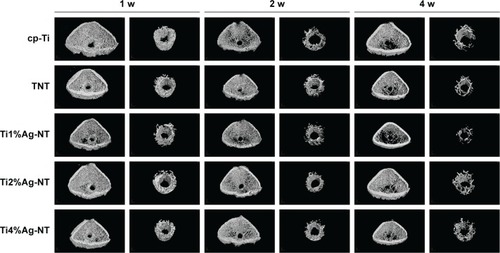
Figure 10 The (A) BV/TV, (B) BS/BV, (C) Tb.N, (D) Tb.Sp, and (E) Tb.Th in the rat femoral condylar insertion model after samples were implanted for 1, 2, and 4 weeks.
Notes: All values are reported as mean ± SD (n=3). *P<0.05 and **P<0.01.
Abbreviations: BS/BV, bone surface per bone volume; BV/TV, bone volume per total volume; cp-Ti, commercially pure Ti; NT, nanotubes; Tb.N, mean trabecular number; Tb.Sp, mean trabecular separation; Tb.Th, mean trabecular thickness; TNT, titanium nanotubes; w, weeks.
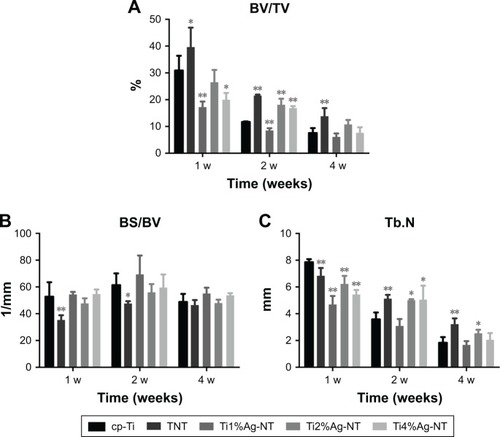
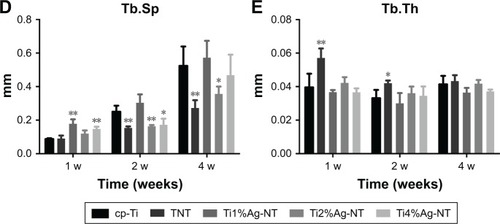
Figure 11 Histological sections of bone formation around implanted samples at 1, 2, and 4 weeks after sample implantation.
Abbreviations: cp-Ti, commercially pure Ti; NT, nanotubes; TNT, titanium nanotubes; w, weeks.
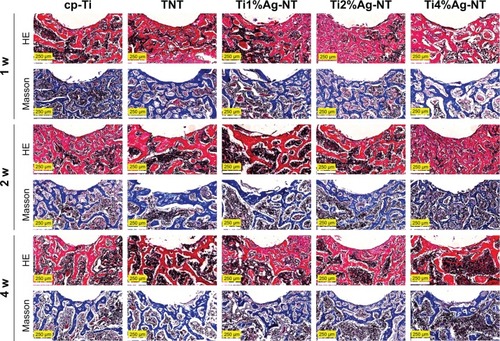
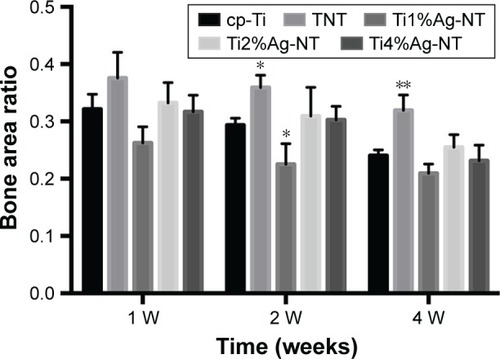
Figure 12 The bone area ratio of each sample at 1, 2, and 4 weeks after sample implantation. All values are reported as mean ± SD (n=3). *P<0.05 and **P<0.01.
Abbreviations: cp-Ti, commercially pure Ti; NT, nanotubes; TNT, titanium nanotubes; w, weeks.