Figures & data
Table 1 Primer sequences used for RT-PCR
Figure 1 Structural property of Gd-BG scaffold.
Notes: (A) SEM image and (B) TEM image of Gd-BGS microspheres; (C) nitrogen adsorption–desorption isotherm, and (D) BJH pore size distribution curve of mesoporous Gd-BGS microspheres. (E) The X-ray diffraction patterns of samples: (I) Gd-BG microspheres and (II) Gd-BG scaffolds. (F) The Fourier transform infrared spectra of samples: (I) Gd-BG microspheres and (II) Gd-BG scaffolds.
Abbreviations: BJH, Barrett–Joyner–Halenda; Gd-BG, gadolinium-doped bioglass; SEM, scanning electron microscopy; TEM, transmission electron microscopy.
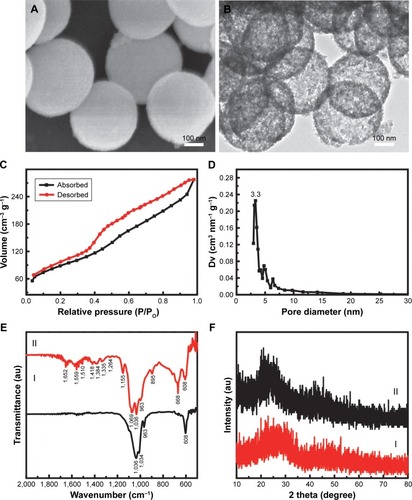
Figure 2 Morphology and chemical composition.
Notes: Characterization of Gd-BG scaffolds: (A) low-resolution SEM image; (B) high-resolution SEM image; (C) Ca element distribution map; (D) Si element distribution map; (E) Gd element distribution map; and (F) energy-dispersive X-ray spectrometry pattern.
Abbreviations: Gd-BG, gadolinium-doped bioglass; SEM, scanning electron microscopy.
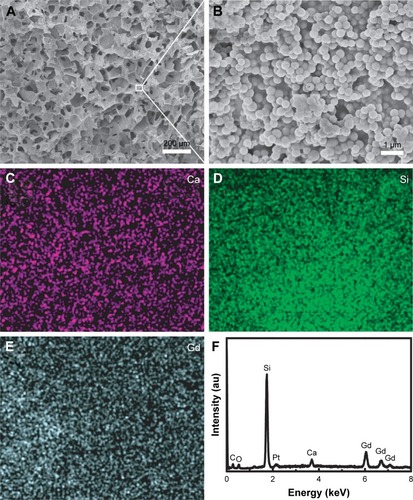
Figure 3 Cell proliferation and adhesion on BG and Gd-BG scaffolds.
Notes: (A) Viability of hBMSCs at different concentrations of BG and Gd-BG scaffolds. SEM images showing the attachment of hBMSCs on (B) BG and (C) Gd1/3-BG. Data are presented as mean ± SD from a representative of three separate experiments performed in quadruplicate (*P<0.05).
Abbreviations: Gd-BG, gadolinium-doped bioglass; hBMSC, human bone marrow-derived mesenchymal stem cell; SEM, scanning electron microscopy.
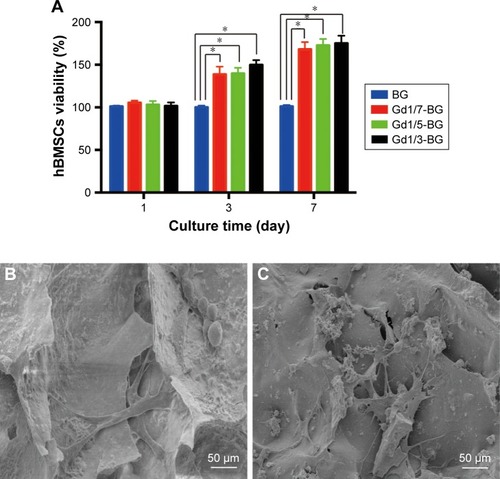
Figure 4 Osteogenic differentiation of hBMSCs in BG and Gd-BG dissolution.
Notes: (A) Effects of BG and Gd-BG dissolution on the ALP activity of hBMSCs after culturing for 7 days. (B) Osteogenic gene expression of BSP and OCN was detected after hBMSCs were treated with BG and Gd-BG dissolution for 3 days. (C) ALP staining showed osteogenic differentiation of hBMSCs treated with BG and Gd-BG dissolution for 14 days (40×). (D) Alizarin red staining showing the mineralization of hBMSCs treated with BG and Gd-BG dissolution for 21 days. Data are presented as mean ± SD from a representative of three separate experiments performed in quadruplicate (**P<0.01).
Abbreviations: Gd-BG, gadolinium-doped bioglass; hBMSC, human bone marrow-derived mesenchymal stem cell.
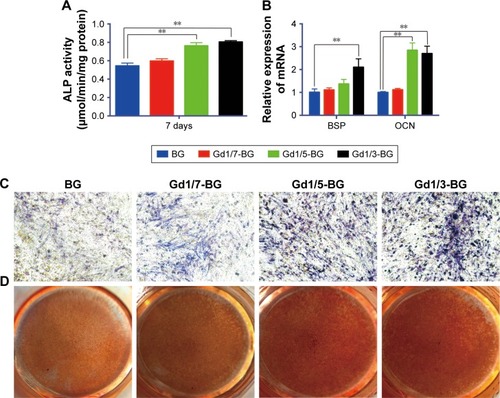
Figure 5 Activation of Akt/GSK3β pathway by Gd-BG.
Notes: (A) Western blotting analysis of p-Akt, total-Akt, p-GSK3β, and total-GSK3β for hBMSCs after treatment with different concentrations of Gd-BG dissolution for 3 hours. GAPDH was used as the loading control. (B) Western blotting analysis of β-catenin for hBMSCs after treatment with different concentrations of Gd-BG dissolution for 24 hours. (C) Western blotting analysis of p-Akt, total-Akt, p-GSK3β, and total-GSK3β for hBMSCs after treatment with BG, Gd1/3-BG dissolution, and Gd1/3-BG dissolution+ LY294002 for 3 hours. (D) Western blotting analysis of β-catenin for hBMSCs after treatment with BG, Gd1/3-BG dissolution, and Gd1/3-BG dissolution+ LY294002 for 24 hours. (E, F) Analysis of protein expression in hBMSCs. (G) Effects of BG, Gd1/3-BG dissolution, and Gd1/3-BG dissolution+ LY294002 on the ALP activity of hBMSCs after culturing for 7 days. (H) ALP staining showed the osteogenic differentiation of hBMSCs after treatment with BG, Gd1/3-BG dissolution, and Gd1/3-BG dissolution+ LY294002 for 14 days (40×). (I) Alizarin red staining showed the mineralization of hBMSCs after treatment with BG, Gd1/3-BG dissolution, and Gd1/3-BG dissolution+ LY294002 for 21 days. Data are presented as mean ± SD from a representative of three separate experiments performed in quadruplicate (**P<0.01).
Abbreviations: ARS, Alizarin red staining; Gd-BG, gadolinium-doped bioglass; hBMSC, human bone marrow-derived mesenchymal stem cell.
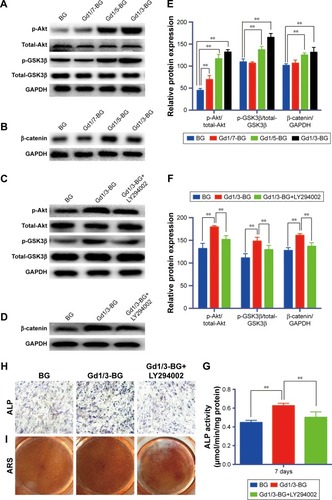
Figure 6 Micro-CT of rat cranial defects implanted with BG and Gd1/3-BG scaffolds at 8 weeks after implantation.
Notes: (A) The images of reconstruction of micro-CT for the bone regeneration of the defect area at week 8. (B, C) BMD and BV/TV in the defects implanted with the Gd1/3-BG and BG scaffolds. Data are presented as mean ± SD from a representative of ten separate experiments (**P<0.01). (D) New bone formation and mineralization measured histomorphometrically by using fluorochrome labeling analysis in rat cranial defects implanted with Gd1/3-BG and BG scaffolds. White arrow indicates the new bone formation. Alizarin red (red) and calcein (green) were intraperitoneally injected at weeks 4 and 6, respectively.
Abbreviations: BMD, bone mineral density; BV/TV, bone volume to total bone volume; CT, computed tomography; Gd-BG, gadolinium-doped bioglass.
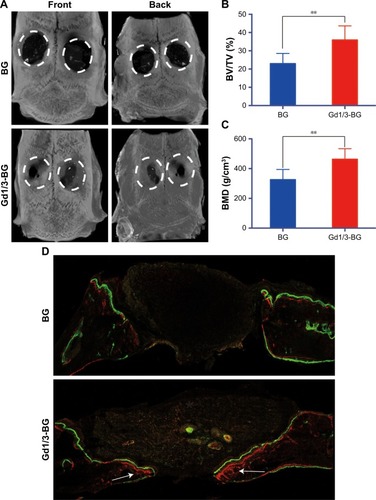
Figure 7 Histological analysis of cranial bone defects.
Notes: (A) H&E, (B) VG, and (C) immunohistochemical staining of OCN in the defects implanted with Gd-BG and BG scaffolds at 8 weeks after implantation. Black stars indicate new bone formation. Green star indicates new collagen formation, and red stars indicate positive staining of OCN.
Abbreviation: Gd-BG, gadolinium-doped bioglass; VG, Van Gieson’s.
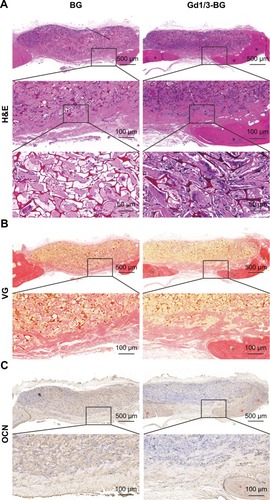
Figure 8 Gd and Akt/GSK3β signaling pathway, where Gd could activate Akt.
Notes: Phosphorylated Akt could prevent GSK3β from forming a complex with β-catenin, resulting in the accumulation of β-catenin. Thus, it could promote osteogenic gene expression and enhance osteogenic differentiation.
Abbreviation: Gd, gadolinium.
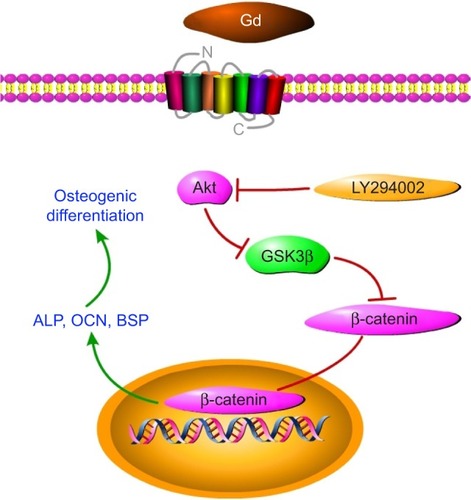
Figure S1 TEM image of BG microspheres without hollow structure.
Abbreviations: BG, bioglass; TEM, transmission electron microscopy.
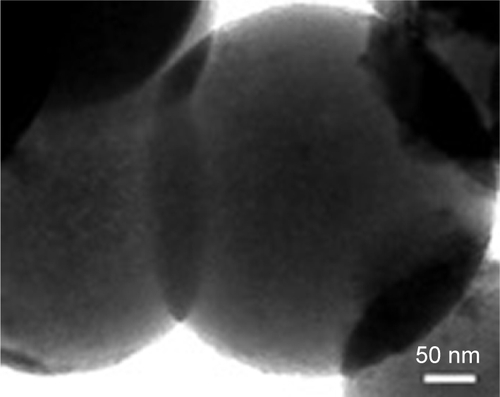
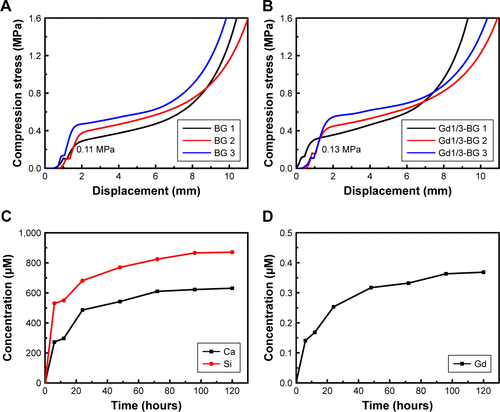
Figure S2 Mechanical property and ion release kinetics of scaffolds.
Notes: Compression strengths of different samples: (A) BG scaffolds; (B) Gd1/3-BG scaffolds. Ion release performances of Gd1/3-BG scaffolds: (C) Ca and Si ions; (D) Gd ions.
Abbreviations: BG, bioglass; Gd, gadolinium.