Figures & data
Table 1 Sequences of forward and reverse primers used for qRT-PCR
Figure 1 Characterization of FMT. (A) Transmission electron micrograph of FMT. (B) Hydration particle size of FMT was shown by dynamic light scattering. (C) Molecular formula of polymer compound coating the outer layer of FMT, where the R group is H or COOH.
Abbreviations: COOH, carboxyl; FMT, ferumoxytol.
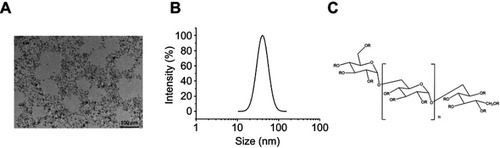
Figure 2 FMT synergizes with CpG ODN 2395 to promote M1-like gene expression in MΦ. Relative mRNA expression was analyzed by qRT-PCR in RAW 264.7 cells following treatment with FMT (100 µg/mL), CpG (2.5 µg/mL), both FMT and CpG (FMT/CpG), or LPS (100 ng/mL) for 12 hrs. Results are expressed as mean ± SDof three independent experiments. *P<0.05, **P<0.01, ***P<0.001 vs control.
Abbreviations: FMT, ferumoxytol; LPS, lipopolysaccharide; MΦ, macrophages; ODN, oligodeoxynucleotide; qRT-PCR, quantitative reverse transcription PCR.
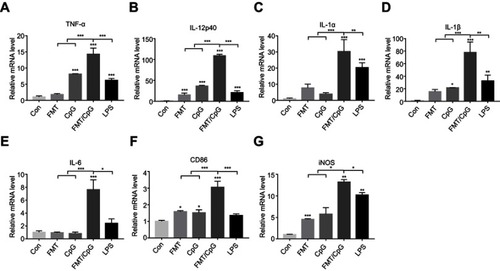
Figure 3 FMT/CpG-pretreated MΦ supernatant reduces H1975 cell viability. (A and B) H1975 cells were incubated with different concentrations of FMT (0–400 µg/mL) or CpG (0–20 µg/mL) for 48 hrs and cell viability was evaluated with the CCK-8 assay. (C) Effect of FMT (100 µg/mL), CpG (2.5 µg/mL), FMT/CpG, the supernatant of MΦ grown for 12 hrs without stimulation (−FMT/CpG MΦS), or supernatant of MΦ pretreated with FMT/CpG for 12 hrs (+FMT/CpG MΦS) on the viability of H1975 cells after 48 hrs. Results are expressed as mean ± SDof three independent experiments. *P<0.05, **P<0.01, ***P<0.001 vs control.
Abbreviations: CCK-8, Cell Counting Kit-8; FMT, ferumoxytol; MΦ, macrophages.
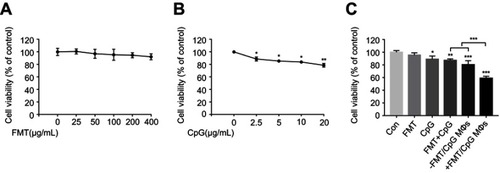
Figure 4 FMT/CpG-pretreated MΦ supernatant induces apoptosis of H1975 cells. (A) H1975 cells were treated with FMT/CpG, −FMT/CpG MΦS or +FMT/CpG MΦS. After 48 hrs, cells were stained with Annexin V/PI and cell apoptosis was analyzed by FCM. (B) Quantitative analysis of apoptotic H1975 cells. (C) Protein levels of Bax, Cleaved Caspase-3, and Cleaved PARP were evaluated by Western blotting in H1975 cells treated as indicated for 48 hrs. (D) Protein levels were quantified with ImageJ software and normalized to that of GAPDH. Results are expressed as mean ± SDof three independent experiments. *P<0.05, ** P<0.01, ***P<0.001 vs control.
Abbreviations: Bax, B-cell lymphoma-2-associated X protein; FCM, flow cytometry; FMT, ferumoxytol; GAPDH, glyceraldehyde 3-phosphate dehydrogenase; MΦ, macrophages; PARP, poly(ADP-ribose) polymerase; PI, propidium iodide.
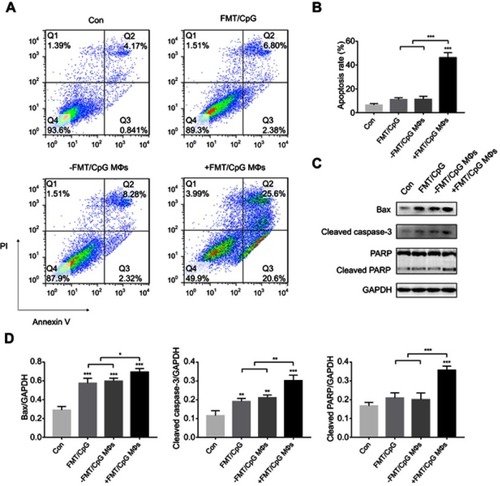
Figure 5 FMT/CpG-pretreated MΦ supernatant inhibits the proliferation of H1975 cells. (A) H1975 cells labeled with CFSE were subjected to indicated treatments for 48 hrs, and the proliferative fraction was analyzed by FCM. (B) Proliferation index of H1975 cells treated as indicated was determined with ModFit LT software. (C and D) Colony formation of H1975 cells following indicated treatments was quantified and the colonies of >50 cells were defined as positive. (E) Protein levels of Cyclin A2 and Cyclin B1 were detected by Western blotting analysis of H1975 cells following indicated treatments for 48 hrs. (F) Protein levels were quantified with ImageJ software and normalized to that of GAPDH. Results are expressed as mean ± SDof three independent experiments. *P<0.05, **P<0.01, ***P<0.001 vs control.
Abbreviations: CFSE, 5(6)-carboxyfluorescein diacetate N-hydroxysuccinimidyl ester; FCM, flow cytometry; FMT, ferumoxytol; GAPDH, glyceraldehyde 3-phosphate dehydrogenase; MΦ, macrophages.
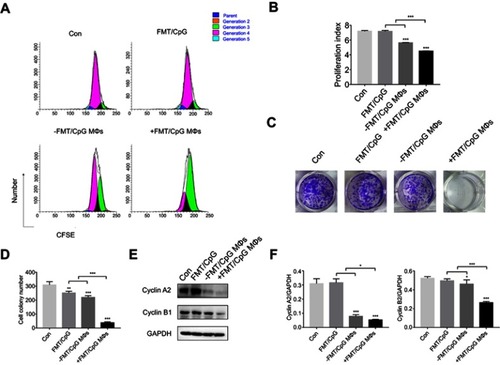
Figure 6 FMT/CpG pretreated MΦ supernatant suppresses the expression of EGFR and downstream signaling in H1975 cells. (A) H1975 cells were treated as indicated for 48 hrs, and protein levels of p-EGFR and its down p-AKT and p-mTOR were analyzed by Western blotting. (B) Protein levels were quantified with ImageJ software and phosphorylated protein levels were normalized to total protein levels. Results are expressed as mean ± SDof three independent experiments. *P<0.05, **P<0.01, ***P<0.001 vs control.
Abbreviations: AKT, protein kinase B; EGFR, epidermal growth factor receptor; FMT, ferumoxytol; MΦ, macrophages; mTOR, mammalian target of rapamycin.
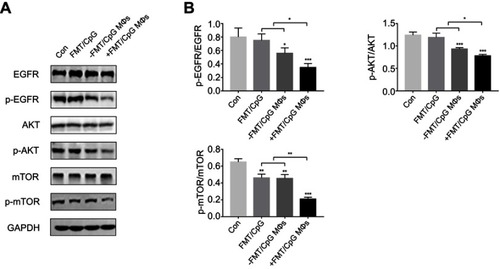
Figure 7 FMT and CpG synergistically inhibit tumor growth in a nude mouse xenograft model. (A) Image of tumors harvested at the end of treatment. (B) Tumor growth curves of tumor-bearing mice. (C) Body weight of tumor-bearing mice during the experiment. (D) Ki-67 and EGFR expression of tumor cells detected by immunohistochemistry. Scale bar: 50 μm. (E) Quantitative analysis of (D). (F) Macrophages stained with F4/80 and iNOS in tumor tissues detected by immunohistochemistry. Scale bar: 50 μm. Results are expressed as mean ± SDof three independent experiments. **P<0.01, ***P<0.001 vs control.
Abbreviation: EGFR, epidermal growth factor receptor; FMT, ferumoxytol.
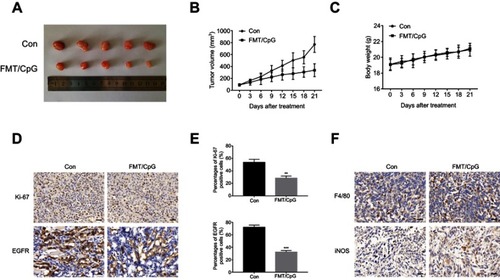
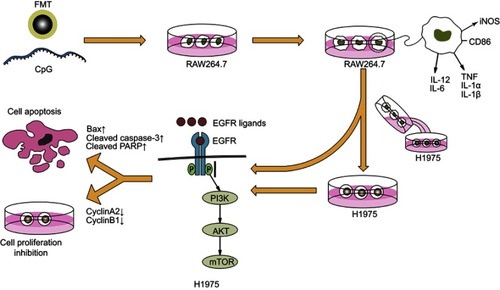
Figure 8 Schematic illustration of synergistic MΦ activation by FMT and CpG for the treatment of NSCLC with EGFRT790M mutation.
Abbreviations: EGFR, epidermal growth factor receptor; FMT, ferumoxytol; MΦ, macrophages; NSCLC, non-small cell lung cancer.