Figures & data
Figure 1 Fabrication of various cell culture platforms.
Notes: (A) Schematic representation of E-jet 3D printing system. (B, C) 3D printed monolayer PLGA-based scaffolds for the culture of C2C12 cells; scale bar in B =1,000 µm. (D, E) 3D printed multilayer PLGA-based scaffolds for the culture of C2C12 cells; scale bar in D =200 µm.
Abbreviations: 3D, three dimensional; E-jet, electrohydrodynamic jet; PLGA, poly lactic-co-glycolic acid.
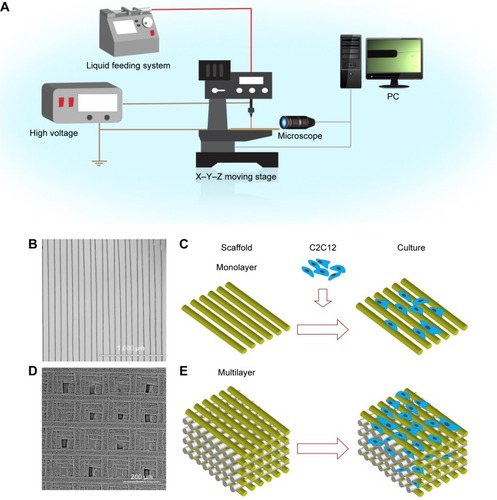
Table 1 Sequences of primers used in qRT-PCR
Figure 2 Characterization of C2C12 cells cultured on PLGA films (control), spheroids, and 3D printed multilayer scaffolds for 7 days.
Notes: (A) Fluorescence images of C2C12 cells stained with calcein-AM and PI (scale bar =100 µm). (B) Death rates of C2C12 cells in A. (C–E) Concentrations of glucose (C), glycogen (D), and lactic acid (E) in the culture medium after 1, 3, 5, and 7 days. *P<0.05, **P<0.005, ***P<0.001.
Abbreviations: 3D, three dimensional; ns, nonsignificant; PI, propidium iodide; PLGA, poly lactic-co-glycolic acid.
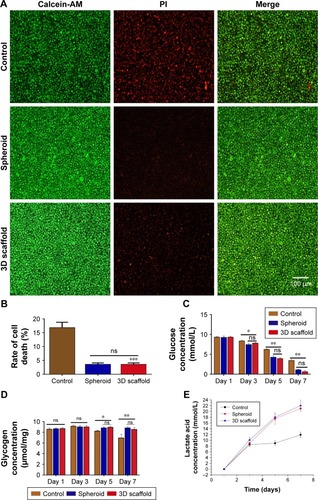
Figure 3 Growth of C2C12 cells cultured on PLGA films (control), spheroids, and 3D printed multilayer scaffolds for 7 days.
Notes: (A) Flow cytometry data (UL, dead cells; UR, late apoptotic cells; LL, healthy cells; and LR, early apoptotic cells). (B) Cell survival rates after 7 days of cell culture. (C) Contents of DNA, collagen, and calcium after 7 days of cell culture. (*P<0.05, **P<0.005).
Abbreviations: 3D, three dimensional; FITC, fluorescein isothiocyanate; PI, propidium iodide; PLGA, poly lactic-co-glycolic acid.
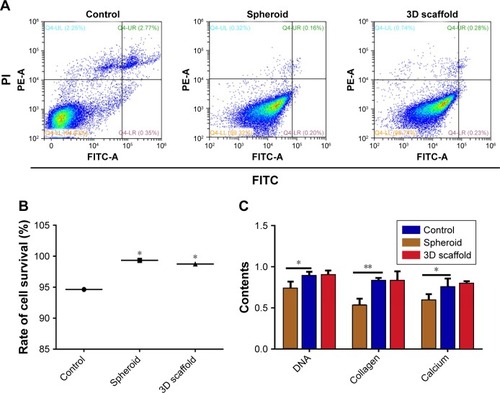
Figure 4 Effects of scaffolds with varying fibrillar gaps on adhesion of C2C12 cells.
Notes: (A) DAPI and vinculin-stained C2C12 cells grown on PLGA films (control) or on 3D printed monolayer scaffolds with various fibrillar gaps of 30, 50, 100, 150, and 200 µm for 4 hours (scale bar =100 µm, dotted lines represent two adjacent fibers). (B) Number of attached cells quantified from A. *P<0.05.
Abbreviations: 3D, three dimensional; ns, nonsignificant; PLGA, poly lactic-co-glycolic acid.
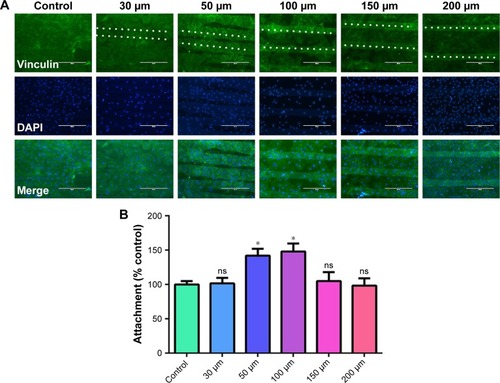
Figure 5 Effects of scaffolds with varying fibrillar gaps on proliferation of C2C12 cells.
Notes: (A) Fluorescence images of C2C12 cells stained with calcein-AM and PI. The cells were grown on PLGA films (control) or on 3D printed scaffolds with different fibrillar gaps (30, 50, 100, 150, and 200 µm) for 48 hours (scale bar =100 µm). (B) Cell survival rates measured from A. (C) Proliferation of C2C12 cells grown for 7 days. The number of cells in control measured after 1 day of cell culture was set to 100%.
Abbreviations: 3D, three dimensional; ns, nonsignificant; PI, propidium iodide; PLGA, poly lactic-co-glycolic acid.

Figure 6 Effects of scaffolds with varying fibrillar gaps on cell differentiation of C2C12 cells.
Notes: (A) Cells grown on 3D printed monolayer scaffolds with varying fibrillar gaps for 5 days. Cell nuclei and F-actin were stained with DAPI (blue) and phalloidin (red), respectively. Dotted lines represent two adjacent fibers. Scale bar =100 µm. (B) Expression levels of MyOG and MyHC proteins in C2C12 cells grown on different 3D printed monolayer scaffolds. (C) Expression levels of MyOG gene in C2C12 cells grown on different 3D printed scaffolds. (D) Expression levels of MyHC gene in C2C12 cells grown on different 3D printed scaffolds. *P<0.05, **P<0.005.
Abbreviations: 3D, three dimensional; MyHC, myosin heavy chain; MyOG, myogenin; PLGA, poly lactic-co-glycolic acid.
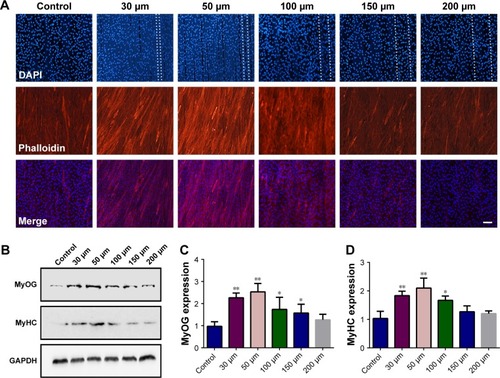
Figure 7 Cell differentiation of C2C12 cells grown on 3D printed scaffold with 50 µm fibrillar gap for 9 days.
Notes: (A) Differentiation of cells at day 1, 3, 5, 7, and 9. Cell nuclei and F-actin were stained with DAPI (blue) and phalloidin (red), respectively. Scale bar =100 µm. (B) Expression levels of MyOG and MyHC proteins in C2C12 cells. (C) Expression of MyOG gene in C2C12 cells. (D) Expression of MyHC gene in C2C12 cells. *P<0.05, **P<0.005, ***P<0.001.
Abbreviations: 3D, three dimensional; MyHC, myosin heavy chain; MyOG, myogenin; PLGA, poly lactic-co-glycolic acid.
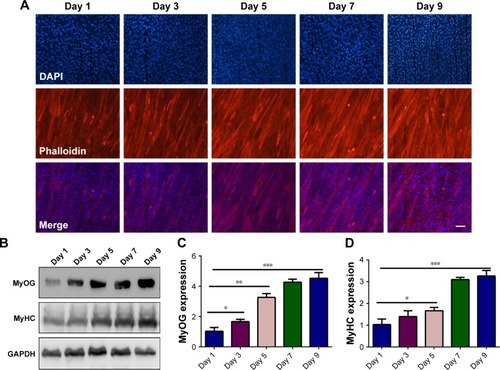
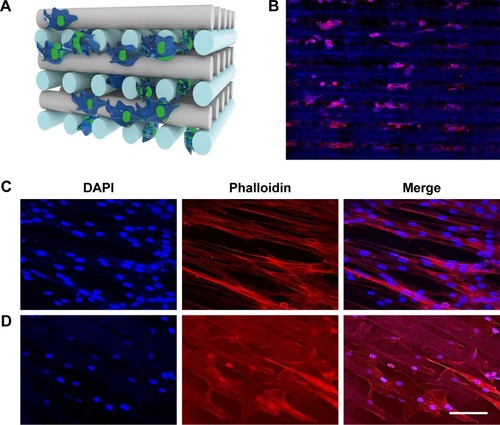
Figure 8 Infiltration and differentiation of C2C12 cells on 3D printed platforms.
Notes: (A) Schematic illustration depicting the infiltration of cells into PLGA 3D printed scaffolds. (B) A fluorescence image showing the infiltration of cells into PLGA 3D printed scaffolds. (C) Fluorescence images showing cell differentiation on the surface of multilayer scaffolds. Cell nuclei and F-actin were stained with DAPI (blue) and phalloidin (red), respectively. (D) Fluorescence images showing cell differentiation inside the multilayer scaffolds. Cell nuclei and F-actin were stained with DAPI (blue) and phalloidin (red), respectively. Scale bar =100 µm.
Abbreviations: 3D, three dimensional; PLGA, poly lactic-co-glycolic acid.