Figures & data
Figure 1 Diameter of GONs.
Notes: (A) Size distribution of nanoparticles as visualized by high-resolution transmission electronic microscopy and (B) dynamic light scattering profiles of GONs suspensions.
Abbreviation: GONs, gadolinium oxide nanocrystals.
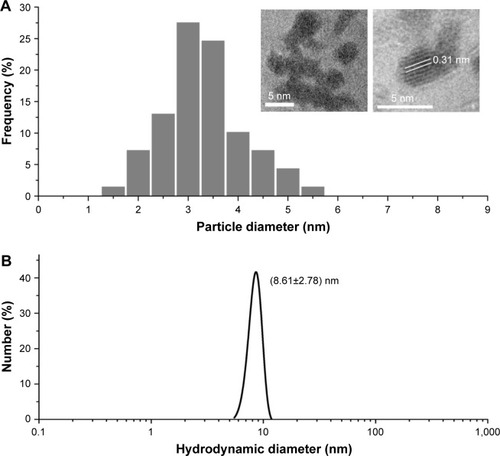
Figure 2 Cytotoxicity and cellular uptake of GONs in NSCLC cells.
Notes: (A) Cytotoxicity of GONs at an incubation time of 24 hours using a CCK-8 kit. (B) Relationship between cellular uptake of Gd in the three studied cell lines and the incubated Gd concentration.
Abbreviations: GONs, gadolinium oxide nanocrystals; NSCLC, non-small-cell lung cancer; Gd, gadolinium.
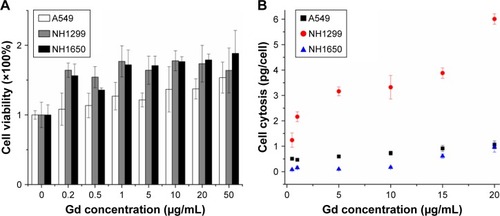
Figure 3 Effects of pretreatment with GONs on the cellular sensitivity to X-ray irradiation.
Notes: Clonogenic assay of A549 (A), NH1299 (B), and NH1650 (C) cells exposed to radiation.
Abbreviation: GONs, gadolinium oxide nanocrystals.
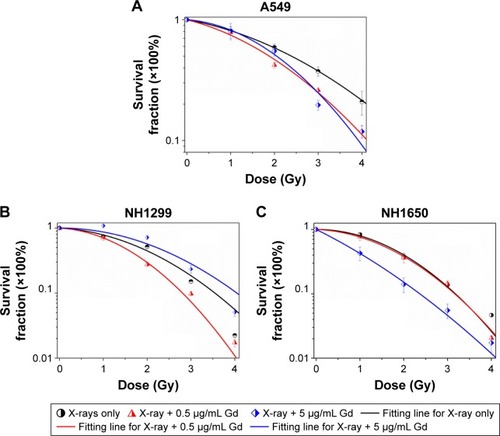
Table 1 Summary of fitting parameters, DSF, and SERSF in the absence and presence of GONs
Figure 4 GONs cause hydroxyl radical and oxidative stress production after their uptake by irradiated NSCLC cells.
Notes: (A) Dependence of the fluorescence intensity variations of 3-CCA on the X-ray irradiated dose without GONs. (B) Hydroxyl radical enhancement of GONs. Oxidative stress levels as detected by DCFH-DA in A549 (C), NH1299 (D), and NH1650 (E) cell lines pretreated with GONs. *p<0.05 or **p<0.01 represents statistically significant or extremely significant differences induced by various radiation dosages. Similarly, #p<0.05 or ##p<0.01 indicates significant differences caused by different Gd concentrations.
Abbreviations: DCFH-DA, 2,7-dichlorohydrofluoroscein diacetate; GONs, gadolinium oxide nanocrystals; NSCLC, non-small-cell lung cancer.
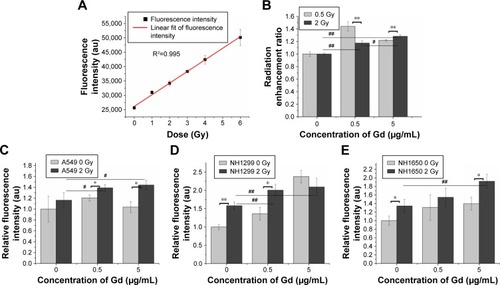
Figure 5 GONs do not increase DNA damage after X-ray irradiation.
Notes: (A) DSB images of NH1299 cells at 1 hour post-radiation; scale bar is 20 µm; cell nuclei dyed with Hoechst 33342 are blue; γ-H2AX foci visualized by incubating with indicated fluorescent antibodies are green. Relative foci number per cell in A549 (B), NH1299 (C), and NH1650 (D) cell lines; CO indicates co-treatment with Gd and X-ray irradiation; CK represents the control.
Abbreviations: DSB, double-strand breakages; GONs, gadolinium oxide nanocrystals; Gd, gadolinium; IR, irradiation.
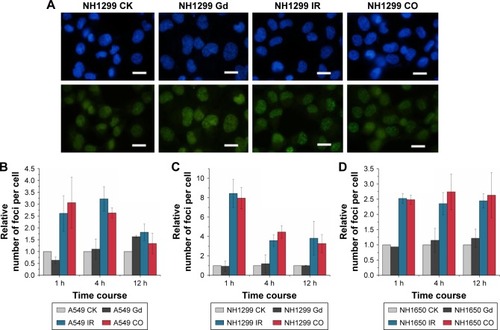
Figure 6 GONs treatment enhances apoptosis in A549 and NH1650 cells but not in NH1299 cells after irradiation.
Notes: (A) Apoptotic rates of A549 cells treated with GONs and/or X-ray irradiation at 24 hours posttreatment. (B) The relative total apoptotic cell ratio analysis for the three studied cell lines. Western blot analyses of apoptosis-related pivotal proteins in A549 (C), NH1299 (D), and NH1650 (E) cells. CK represents the control; CO represents the co-treatment with irradiation and GONs. **p<0.01 represent extremely significant differences.
Abbreviations: GONs, gadolinium oxide nanocrystals; IR, irradiation.
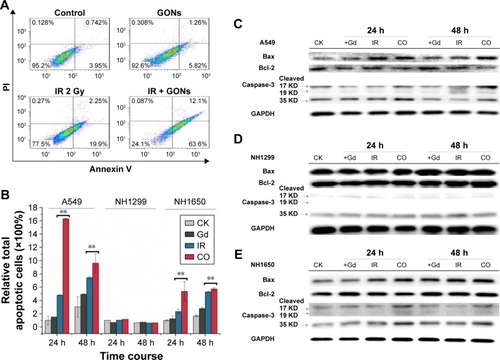
Figure 7 Enhanced cytostatic autophagy caused by GONs under X-ray irradiation.
Notes: (A) Autophagy incidence of A549 cells treated with GONs and/or radiation in the absence/presence of 3-MA at 4 hours posttreatment. (B) Western blot analysis of the variation in LC3-II toward various treatments for the three cell lines. Autophagic cell ratio analyses detected by flow cytometry for A549 (C), NH1299 (D), and NH1650 (E) cells; *p<0.05 and **p<0.01 represent statistically significant or extremely significant differences, respectively, between cells irradiated alone and those co-treated with radiation and GONs; #p<0.05 and ##p<0.01 indicate statistically significant differences in the relative incidence of autophagy by pretreating with 3-MA 4 hours before radiation. (F–H) Survival fraction of A549 (F), NH1299 (G), and NH1650 (H) cells under combination treatment with radiation and GONs with or without 3-MA; CK represents the control.
Abbreviations: GONs, gadolinium oxide nanocrystals; 3-MA, 3-methyladenine; IR, irradiation; Gd, gadolinium.
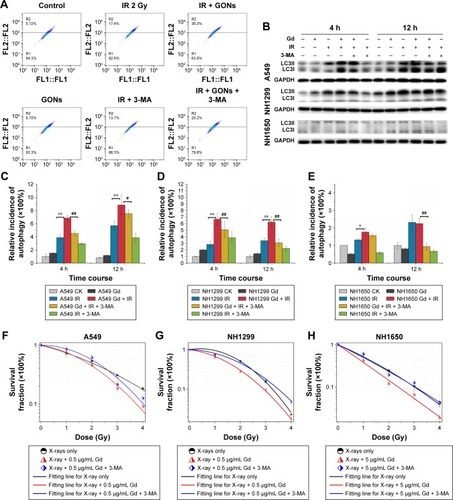
Figure S1 Ultraviolet-visible spectra results confirm that GON solution is very stable in RPMI 1640 medium.
Notes: (A) Absorbance of GON with different concentrations after incubating at 37°C for 24 hours. (B, C) Absorbance of GON at concentrations 0.5 µg/mL (B) and 5.0 µg/mL (C) at various incubation time.
Abbreviation: GONs, gadolinium oxide nanocrystals.
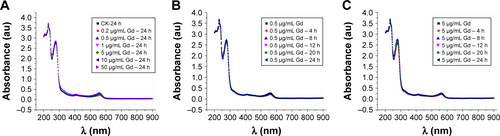
Figure S2 The influence of GON on cell cycle distribution.
Notes: (A) Cell flow spectra at 24 hours after X-ray irradiation. (B) Cell cycle distributions of three studied cells on time. CK represents the control; CO represents co-treatment with irradiation and GONs.
Abbreviations: GONs, gadolinium oxide nanocrystals; Gd, gadolinium; IR, irradiation.
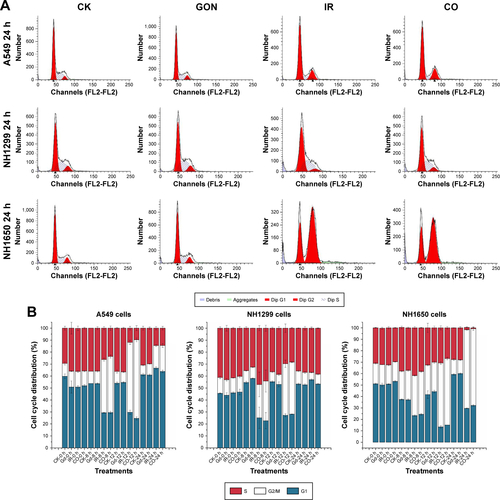
Figure S3 Apoptotic rates of A549, NH1299, and NH1650 cells treated with GON and/or radiation for 24-hour and 48-hour posttreatment.
Note: CK represents the control; CO represents co-treatment with irradiation and GONs.
Abbreviations: GONs, gadolinium oxide nanocrystals; Gd, gadolinium; IR, irradiation.
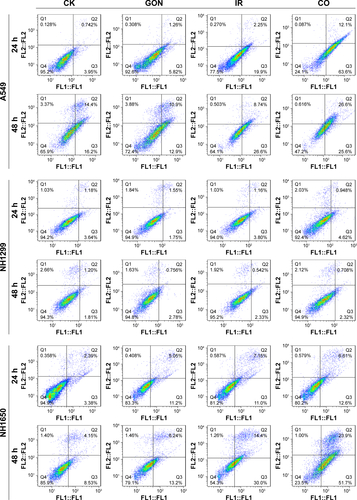
Figure S4 Autophagy incidence of A549, NH1299, and NH1650 cells treated with GON and/or X-ray irradiation for 4-hour and 12-hour posttreatment.
Note: CK represents the control; CO represents co-treatment with irradiation and GONs.
Abbreviations: GONs, gadolinium oxide nanocrystals; Gd, gadolinium; IR, irradiation.
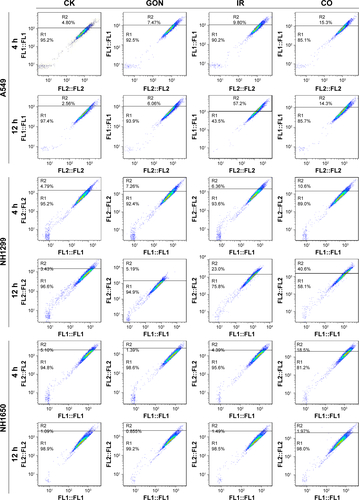
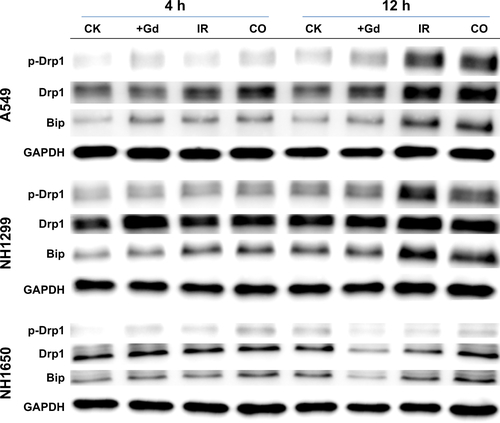
Figure S5 Radiation-induced damages in cytoplasm stimulate the ER stress and mitochondrion dysfunction.
Note: CK represents the control; CO represents co-treatment with irradiation and GONs.
Abbreviations: ER, endoplasmic reticulum; Gd, gadolinium; IR, irradiation.