Figures & data
Figure 1 (A) FTIR spectra of ACC (a), MIT (b), ACC-MIT (c), PL (d), and PL/ACC-MIT (e). (B) Representative TEM (upper) and size distribution (lower) of ACC-MIT and PL/ACC-MIT nanoparticles. Scale bar: 100 nm. Inset images demonstrated Tyndall effect of nanoparticles. (C) Zeta potential of ACC-MIT and PL/ACC-MIT. (D) Stability of ACC-MIT and PL/ACC-MIT nanoparticles in different media. Main figure shows the size change of ACC-MIT and PL/ACC-MIT nanoparticles incubated with 20% mouse plasma for 2 hours. Inset image shows the storage stability of PL/ACC-MIT in PBS and plasma, respectively. Results were expressed as mean ± SD (n=3).
Abbreviations: ACC, amorphous calcium carbonate; FTIR, Fourier-transform infrared spectroscopy; MIT, mitoxantrone; PL, phospholipid; TEM, transmission electron microscopy.
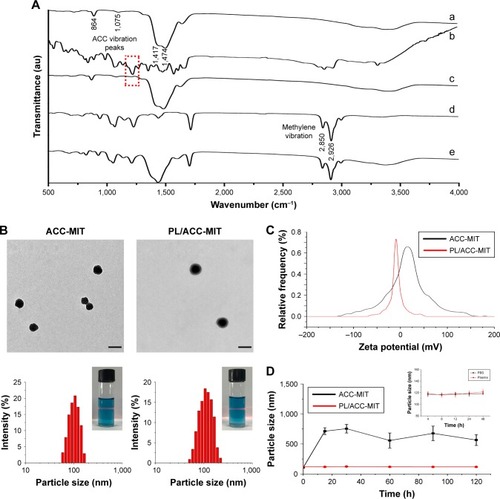
Figure 2 (A) Hemolysis of PL/ACC-MIT and (B) in vitro drug release profiles of ACC-MIT and PL/ACC-MIT nanoparticles under different pH (7.4 and 5.5) conditions. Results were expressed as mean ± SD (n=3).
Abbreviations: ACC, amorphous calcium carbonate; MIT, mitoxantrone; PL, phospholipid.
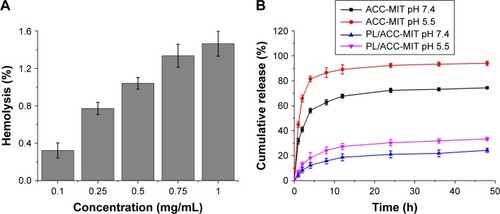
Figure 3 (A) In vitro cellular uptake of C6-loaded PL/ACC nanoparticles in HeLa and A549 cells as a function of incubation time (2, 4, and 8 hours). (B) Time-dependent intracellular drug localization of PL/ACC-MIT nanoparticles in HeLa cells. (C) Calculation of time-dependent Pearson correlation index between blue (nucleus) and red (MIT) signals. For each panel, blue: Hoechst 33342-stained nuclei; green: C6 indicated nanoparticles; red: MIT. (D) Intracellular trafficking of PL/ACC-MIT nanoparticles in HeLa cells at 4 hours post-incubation. For each panel, Ca: Fluo-4 AM indicated Ca2+ (green); Lyso: LysoTracker Blue-stained endolysosome (blue); MIT: MIT (red); Merge/RB: merge of MIT and endolysosome (purple); Merge/RG: merge of MIT and Ca2+ (yellow); Merge/3: merge of all three colors. (E) Calculation of co-localization ratio between different channels. Results were expressed as mean ± SD (n=3). Scale bar: 20 µm.
Abbreviations: ACC, amorphous calcium carbonate; C6, coumarin-6; MIT, mitoxantrone; PL, phospholipid.
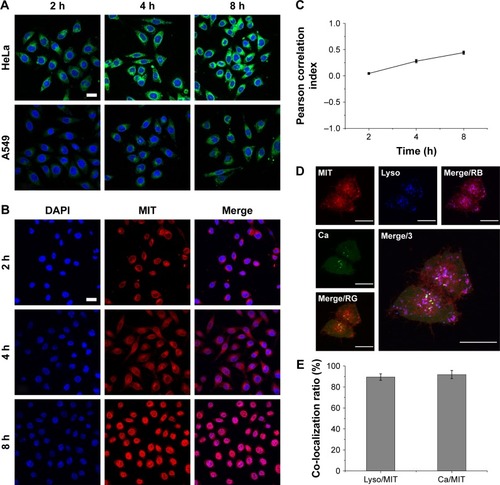
Figure 4 In vivo tumor targeting assay of DiR-loaded PL/ACC-MIT nanoparticles.
Notes: (A) Real time in vivo distribution of nanoparticles in oxgraft model co-bearing HeLa and A549 tumors. (B) Representative ex vivo NIR fluorescence images and semi-quantitative analysis of tumors at 36 hours postinjection. Results were expressed as mean ± SD (n=3). (C) In vivo distribution of free DiR (left) and nanoparticles (right) in oxgraft model bearing HeLa tumor at 12 hours post-incubation. (D) Representative ex vivo NIR fluorescence images (dissected main organs and tumors) of free DiR (upper) and nanoparticles (lower) at 36 hours postinjection.
Abbreviations: ACC, amorphous calcium carbonate; DiR, 1,1′-dioctadecyl-3,3,3′,3′-tetramethyl indotricarbocyanine iodide; MIT, mitoxantrone; NIR, near-infrared; PL, phospholipid.
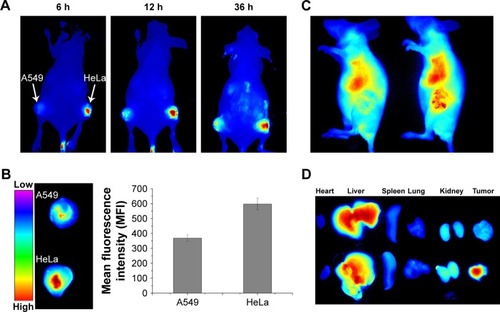
Figure 5 Enhanced drug penetration of PL/ACC-MIT nanoparticles in tumor tissue.
Notes: (A) In vitro penetration of MIT into the MCTS after incubation with free MIT or PL/ACC-MIT nanoparticles for 24 hours. (B) In vivo penetration of nanoparticles into the tumor tissue after intratumoral injection of free MIT or PL/ACC-MIT nanoparticles for 24 hours. The frozen tumor sections were observed from the top (injection site) of the tumor to the middle using CLSM. The nuclei were stained by DAPI (blue). Scale bar: 200 µm.
Abbreviations: ACC, amorphous calcium carbonate; CLSM, confocal laser scanning microscopy; MCTS, multicellular tumor spheroid; MIT, mitoxantrone; PL, phospholipid.
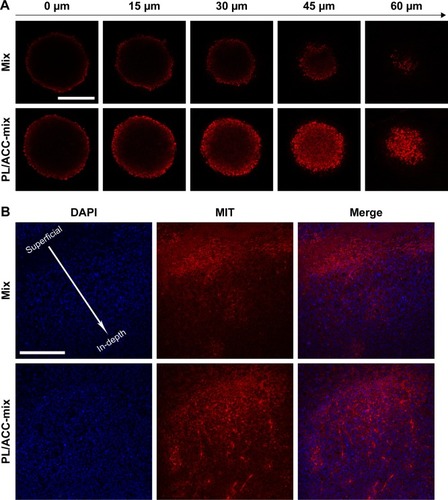
Figure 6 In vitro cytotoxicity of PL/ACC-MIT nanoparticles.
Notes: (A) Cell viabilities of HeLa cells incubated with drug-free PL/ACC at different nanoparticle concentrations (10–200 µg/mL) for 24 and 48 hours. (B) Cell viabilities of HeLa cells incubated with free MIT or PL/ACC-MIT nanoparticles at different MIT concentrations (0.01–10 µg/mL) for 24 and 48 hours. (C) Representative optical and fluorescent images of HeLa cells treated with different formulations (MIT concentration of 10 µg/mL) for 24 and 48 hours. (D) The diameter changes of MCTS after treatment with saline, free MIT, or PL/ACC-MIT nanoparticles for 6 days (MIT concentration: 2 µg/mL). (E) Optical images of MCTS after treatment with different formulations. Results were expressed as mean ± SD (n=3). Scale bar: 200 µm.
Abbreviations: ACC, amorphous calcium carbonate; MCTS, multicellular tumor spheroid; MIT, mitoxantrone; PL, phospholipid.
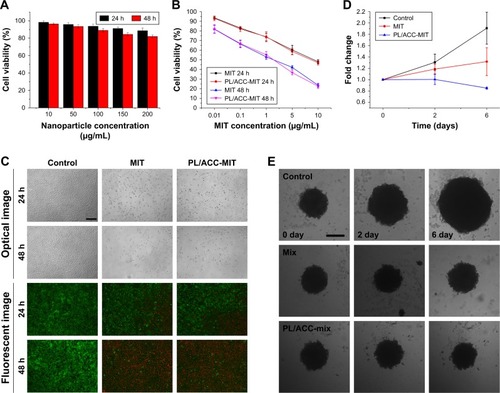
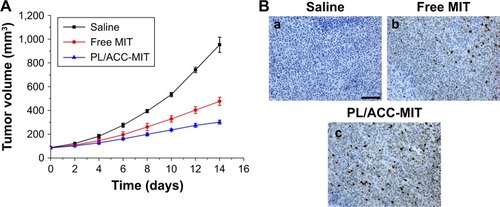
Figure 7 (A) Tumor volume and (B) representative images of ex vivo tumor sections assayed by immunohistology using TUNEL antibodies.
Notes: Scale bar: 200 µm. a for saline, b for free MIT and c for PL/ACC-MIT.
Abbreviations: ACC, amorphous calcium carbonate; MIT, mitoxantrone; PL, phospholipid.