Figures & data
Figure 1 Confocal Laser Scanning Microscope (CLSM) image of OVA- MNPs@SiO2(RITC). (A) For the preparation of the nanoparticles,Citation20 OVA (50 μg/mL) and MNPs@SiO2(RITC) (50 μg/mL) were mixed for 60 min. (B) MNPs@SiO2(RITC): Rhodamine 123: excitation558, emission; 581 OVA: FITC: excitation 488, emission 519.
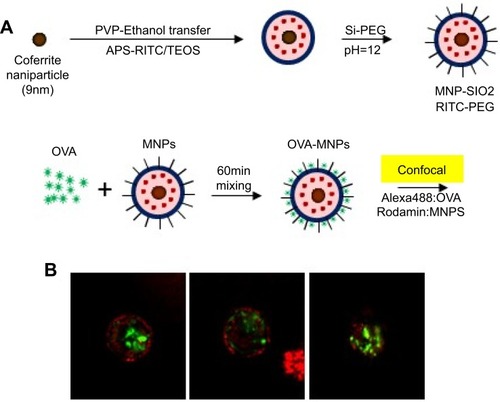
Figure 2 MNPs@SiO2(RITC) were low cytotoxic to BMDCs. BMDCs were treated with the indicated concentrations (12.5 μg/mL, 25 μg/mL, 50 μg/mL, and 100 μg/mL) of MNPs@SiO2(RITC) for 24 h, stained with Annexin V-FITC and PI, and analyzed by flow cytometry (A) Dot plot, (B) Live cell percentage, %. The results are representative of three experiments.
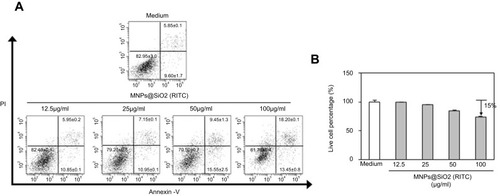
Figure 3 Antigen uptake of OVA-Alexa488 by BMDCs is enhanced by MNPs@SiO2(RITC). BMDCs were incubated for various times with either OVA-Alexa488 or OVA-Alexa488-MNPs@SiO2(RITC) and stained with PE-conjugated anti-CD11C. BMDCs incubated at 37 °C with OVA-Alexa488 or OVA-Alexa488-MNPs@SiO2(RITC). Intracellular antigen uptake of OVA-Alexa488 was investigated by (A) confocal microscopy (B) Flow cytometry. Data are presented as the percentage (%) of Alexa488 fluorescence of CD11C-positive cells. The results are representative of three experiments. ***p<0.001 vs untreated BMDCs. ###p<0.001 vs OVA-pulsed BMDCs.
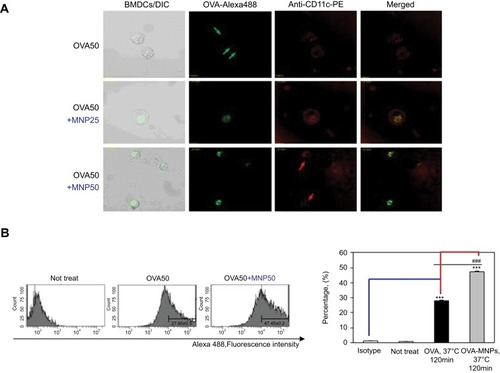
Figure 4 MNPs@SiO2(RITC) enhances BMDC cytokine production. Immature BMDCs (1×10⁶ cells) derived from C57BL/6 mice were incubated for 24 h at 37 °C with LPS or MNPs@SiO2(RITC). Cytokine were analyzed by ELISA. The results are representative of three experiments. *p<0.05, **p<0.01, and ***p<0.001 vs untreated BMDCs.
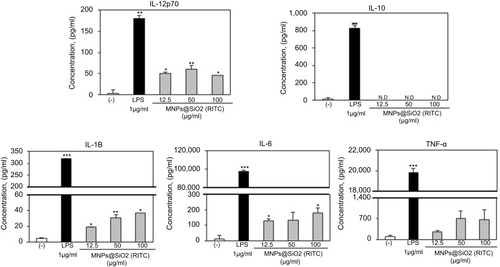
Figure 5 MNPs@SiO2(RITC) enhanced BMDC cytokine production. Immature BMDC derived (1×10⁶) from C57BL/6 mouse were incubated for 24 h at 37 °C with OVA, OVA-MNPs@SiO2(RITC). Cytokines were analyzed by ELISA. The results are representative of three experiments. *p<0.05 and ***p<0.001 vs compared untreated BMDCs. #p<0.05, ##p<0.01, and ###p<0.001 vs OVA-pulsed BMDCs.
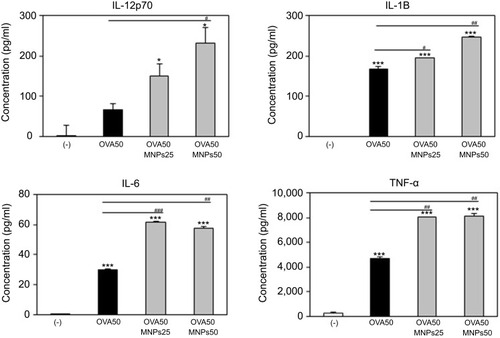
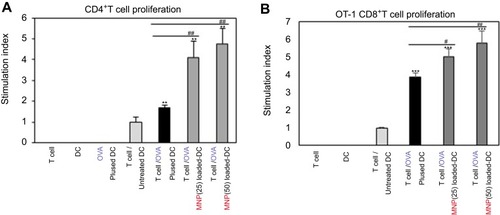
Figure 6 MNPs@SiO2(RITC) enhanced antigen-specific CD4+ T cell (A) proliferation and (B, C) cytokine production. CD4+ T cell proliferative and cytokine productive responses by mBMDC pretreated with OVA, OVA-MNPs@SiO2(RITC) were assessed. *p<0.05 and ***p<0.001 compared with T cell/Untreated BMDCS. ##p<0.01 and ###p<0.001 compared with T cell/OVA pulsed BMDCs.
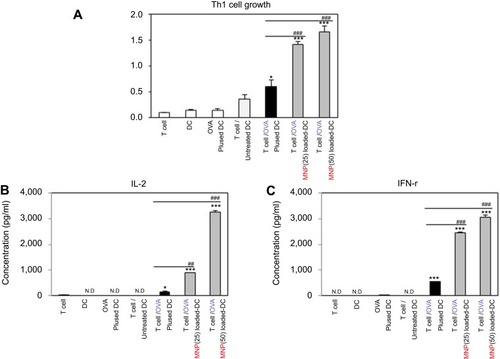
Figure 7 MNPs@SiO2(RITC) enhanced antigen-specific CD8+ T cell (A) proliferation and (B, C) cytokine production. CD8+ T cell proliferative and cytokine productive responses by mBMDC pretreated with OVA, OVA-MNPs@SiO2(RITC) were assessed. *p<0.05, **p<0.01, and ***p<0.001 compared with T cell/Untreated BMDCS. #p<0.05 compared with T cell/OVA pulsed BMDCs.
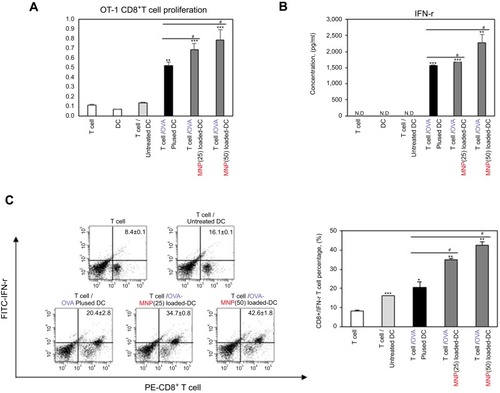
Figure 8 Analysis of anti-tumor immunity for therapeutic effect. EG7-OVA tumor cells (1×10⁵ cells) were inoculated subcutaneously into mice (n=4/group) 1days before injection of OVA or OVA-MNPs@SiO2(RITC). (A) Experimental scheme for the anti-tumor immunity therapy (B) Tumor growth was monitored by measuring the tumor volume of mice. Photographs of the dissected tumor tissue from each group are also shown. (C) Tumor weight of the dissected tumor tissue from each group was also shown. (D, E) Subsets in tumor cells measured gated and analyzed using a FACScanto II (BD Biosciences). Data are represented as mean ± SD of four mice per group. *p<0.05, **p<0.01, and ***p<0.001 compared with negative PBS group. #p<0.05 and ##p<0.01 compared with OVA group.
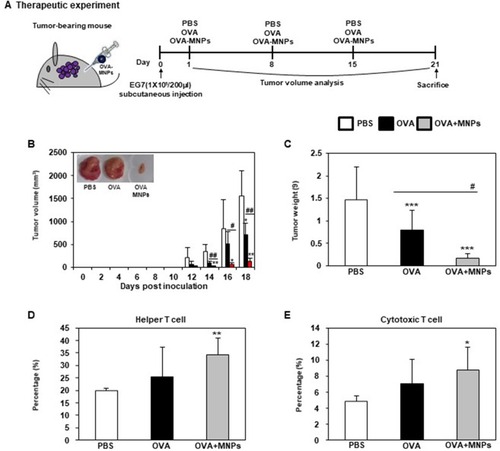
Figure 9 Analysis of anti-tumor immunity for therapeutic effect. EG7-OVA tumor cells (1×10⁵ cells) were inoculated subcutaneously into mice (n=4/group) 1 days before injection of OVA or OVA-MNPs@SiO2(RITC). OVA or OVA-MNPs@SiO2(RITC) immunization induces OVA-specific CTL activity. The mice (n=4/group) were sacrificed and the splenocytes of each group were harvested for the in vitro killing assay (E/T=25, 50, and 100). Data are represented as mean ± SD of four mice per group. *p<0.05 compared with negative PBS group. #p<0.05 compared with OVA group.
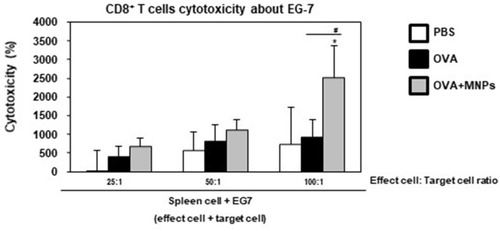
Figure 10 Analysis of anti-tumor immunity for therapeutic effect. EG7-OVA tumor cells (1×10⁵ cells) were inoculated subcutaneously into mice (n=4/group) 1 days before injection of OVA or OVA-MNPs@SiO2(RITC). The splenocytes of each group were re-stimulated with OVA 7 days after the last immunization. (A, D) The proliferation of the splenocytes and lymphocytes were assessed using a Bromo-kit. The culture supernatants were harvested after 24 h, and the cytokine levels were measured by ELISA. The splenocytes of each group were re-stimulated with OVA 7 days after the last immunization and (B)CD8+, and (C)CD4+ T cells were then gated and analyzed using a FACScanto II (BD Biosciences) by staining with FITC-anti-IFN-γ and PE-anti-CD4/CD8. Data are represented as mean ± SD of four mice per group. *p<0.05, **p<0.01, and ***p<0.001 compared with negative PBS group. #p<0.05, and ##p<0.01 compared with OVA group.
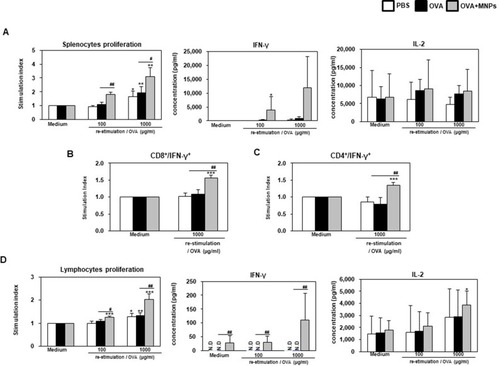
Figure S1 Proliferation of CD4+ T cells and CD8+ T cells. MNPs@SiO2(RITC) enhanced (A) antigen-specific CD4+ T cell proliferation stimulation index. (B) antigen-specific CD8+ T cell proliferation. CD4+ and CD8+ T cell proliferative responses by mBMDC pretreated with OVA, OVA-MNPs@SiO2(RITC) were assessed. *p<0.05, **p<0.01 or ***p<0.001 compared with T cell/Untreated BMDCS. #p<0.05 and ##p<0.01 compared with T cell/OVA pulsed BMDCs