Figures & data
Figure 1 Intrinsic fluorescence quenching of tau in the absence and presence of increasing doses of TiO2 NPs at room temperature.
Abbreviations: NPs, nanoparticles; TiO2, titanium dioxide.
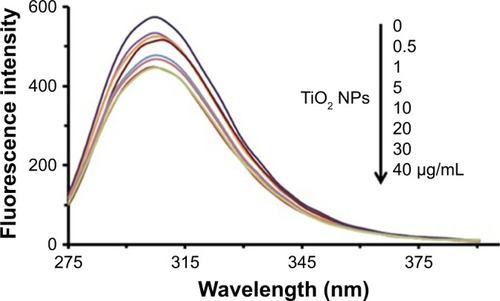
Figure 2 Stern–Volmer plot for the interaction of tau with TiO2 NPs.
Abbreviations: NPs, nanoparticles; TiO2, titanium dioxide.
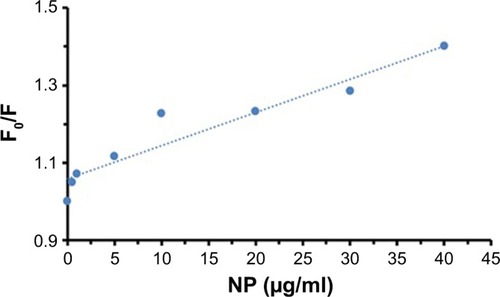
Table 1 KSV values of TiO2 NPs/tau complex and its comparison with other reported KSV values
Figure 3 ANS fluorescence of tau in the absence and presence of increasing doses of TiO2 NPs at room temperature.
Abbreviations: ANS, 8-anilinonaphthalene- 1-sulfonic acid; NPs, nanoparticles; TiO2, titanium dioxide.
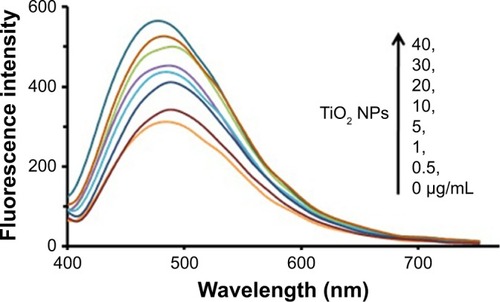
Figure 4 ThT fluorescence intensity of tau in the absence and presence of increasing doses of TiO2 NPs at room temperature.
Abbreviations: NPs, nanoparticles; ThT, thioflavin T; TiO2, titanium dioxide.
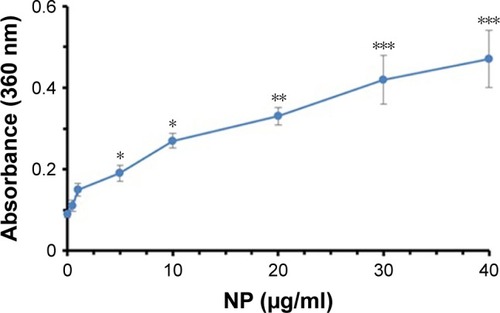
Figure 5 The absorbance intensity of tau at 360 nm in the absence and presence of increasing doses of TiO2 NPs at room temperature.
Note: *P<0.05, **P<0.01, and ***P<0.001 vs control group.
Abbreviations: NPs, nanoparticles; TiO2, titanium dioxide.
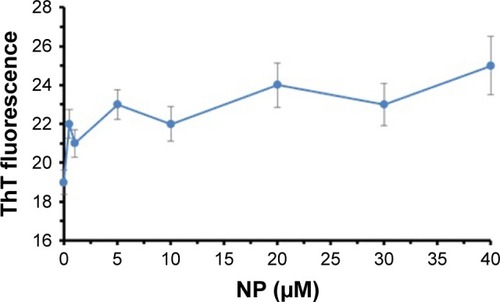
Figure 6 CD signals of tau in the absence and presence of TiO2 NPs at room temperature.
Abbreviations: NPs, nanoparticles; TiO2, titanium dioxide.
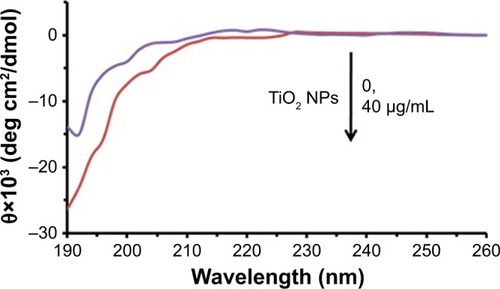
Figure 7 TEM observation of TiO2 NPs samples incubated without (A) or with (B) tau. Black and white arrows show TiO2 NPs and amorphous tau aggregates, respectively.
Abbreviations: NPs, nanoparticles; TEM, transmission electron microscopy; TiO2, titanium dioxide.
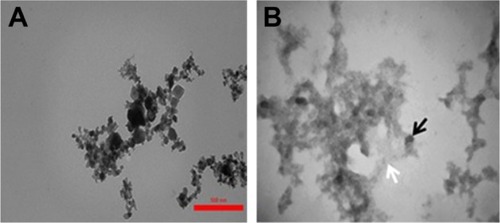
Table 2 Docking results of (TiO2)22 with tau segments
Table 3 Docking results of (TiO2)38 with tau segments
Figure 8 Two clusters of TiO2 NPs with different sizes.
Abbreviations: NPs, nanoparticles; TiO2, titanium dioxide.
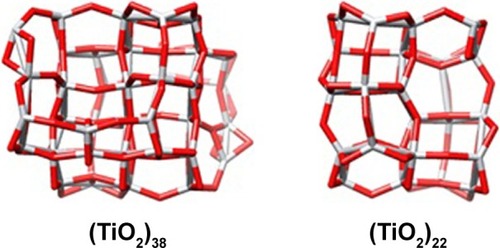
Figure 9 Docking site of interaction between (TiO2)22 cluster and tau segments.
Note: (A) 2MZ7, (B) 4E0N, (C) 5O3T.
Abbreviation: TiO2, titanium dioxide.
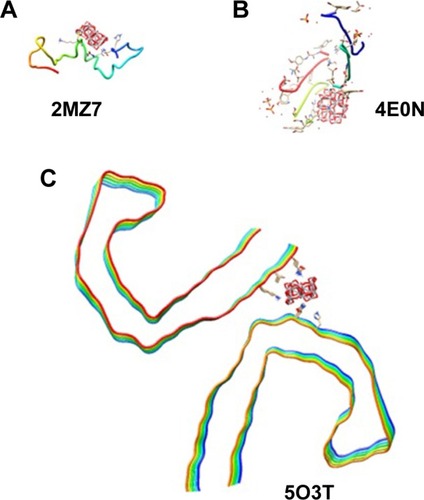
Figure 10 Docking site of interaction between (TiO2)38 cluster and tau segments.
Note: (A) 2MZ7, (B) 4E0N, (C) 5O3T.
Abbreviation: TiO2, titanium dioxide.
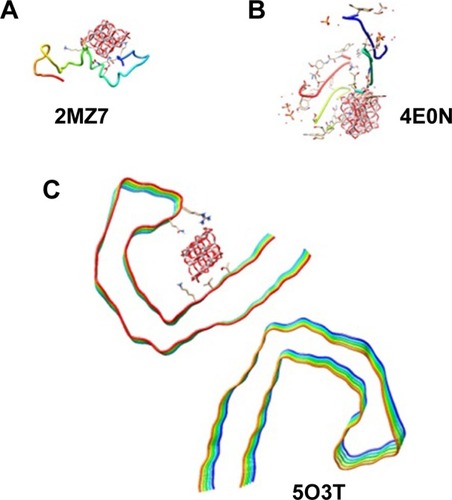
Figure 11 The closest interacting residues of (TiO2)22 and (TiO2)38 clusters after interaction with tau segments.
Abbreviations: NPs, nanoparticles; TiO2, titanium dioxide.
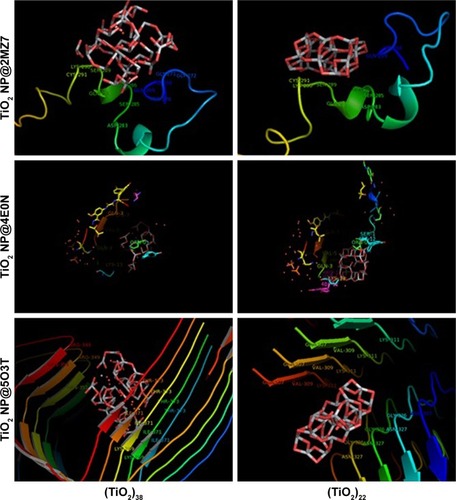
Figure 12 The molecular dynamic study of 2MZ7 segment in the presence (A) and absence (B) of TiO2 cluster after 300 ps evolution.
Abbreviation: TiO2, titanium dioxide.
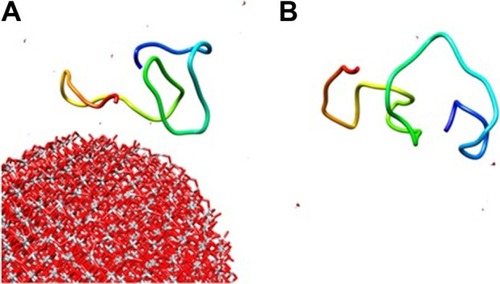
Figure 13 Effect of tau (100 µg/mL), TiO2 NPs (0.01–100 µg/mL), and TiO2 NPs/tau complex (100 µg/mL/100 µg/mL) on viability of SH-SY5Y cells.
Notes: Cell viability was studied using the MTT assay. Data are shown as mean ± SE of three independent experiments. *P<0.05 and **P<0.01 vs negative control group (0 µg/mL of TiO2 NP). #P<0.05 vs TiO2 NP (100 µg/mL of TiO2 NP) group.
Abbreviations: NPs, nanoparticles; SE, standard error of mean; TiO2, titanium dioxide.
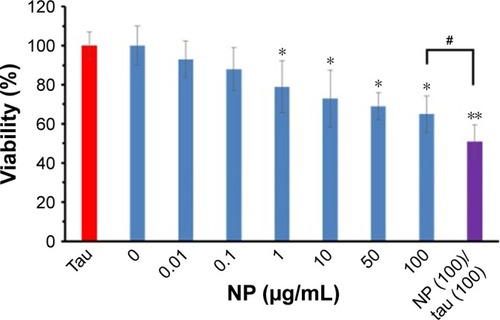
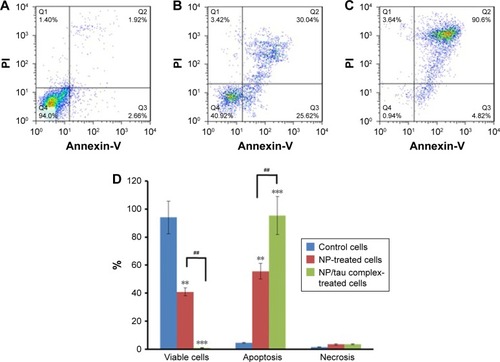
Figure 14 Probing the apoptosis induction of TiO2 NPs (0 µg/mL) (A), TiO2 NPs (100 µg/mL) (B), and TiO2 NPs/tau complex (100 µg/mL/100 µg/mL) (C) in SH-SY5Y cells by flow cytometry assay; the column graph represents the statistical analysis of apoptosis induction in SH-SY5Y cells by TiO2 NPs (D).
Notes: Data are shown as mean ± SE of three independent experiments. **P<0.01 and ***P<0.001 vs negative control group (0 µg/mL of TiO2 NP). ##P<0.01 vs TiO2 NP (100 µg/mL of TiO2 NP) group.
Abbreviations: NPs, nanoparticles; PI, propidium iodide; SE, standard error of mean; TiO2, titanium dioxide.