Figures & data
Figure 1 (A) Illustration of trityl-loaded FMSNs for electron paramagnetic resonance imaging. FMSN with targeting moiety, TAG72mAb, as a carrier for trityl radical for in vivo tumor oxygen measurement. (B) Transmission electron microscope (TEM) image of mesoporous silica nanoparticles. (C) Thermogravimetric analysis of FMSN, FMSN-PEG, and FMSN-PEG-TAG72. (D) EPR spectrum of trityl (black), FMSN-trityl (red), and overlay.
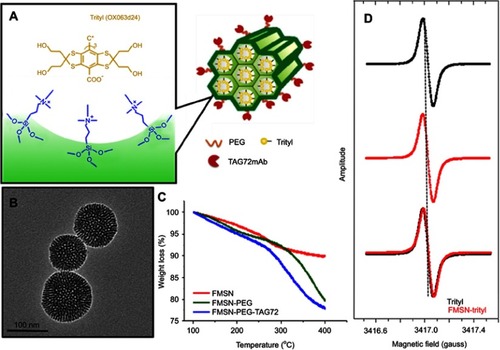
Figure 2 Oxygen response of FMSN-trityl. (A) EPR spectrum of trityl and FMSN-trityl at various oxygen concentrations. The spectra are scaled to the same maximum amplitude height in the plots. (B) The dependence of peak-to-peak EPR spectrum line width of trityl/FMSN-trityl on oxygen partial pressure. (C) The dependence of peak-to-peak EPR spectrum line width of FMSN-trityl at different pH levels.
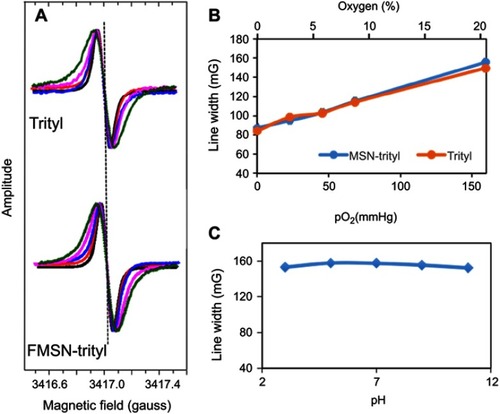
Figure 3 Cell uptake of FMSN-trityl. Fluorescent confocal images of cells treated with (A) PBS, (B) trityl-loaded FMSN-PEG, (C) trityl-loaded FMSN-PEG-TAG72. Trityl-loaded FITC-MSNs (green); nucleus stain, DAPI (blue); and cell membrane stain, WGA647 (red). (D) Histogram of cell counts from flow cytometer. X-axis shows the intensity of FITC.
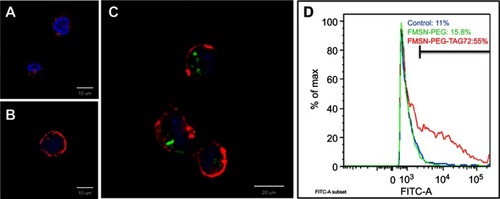
Figure 4 Cell oxygen consumption. (A) EPR spectra of cells treated with trityl-loaded FMSN-PEG-TAG72 at various time points. (B) The peak-to-peak line width of EPR spectra was converted to pO2 (mmHg) and plotted with time. Dwell time per scan is 5.12 s.
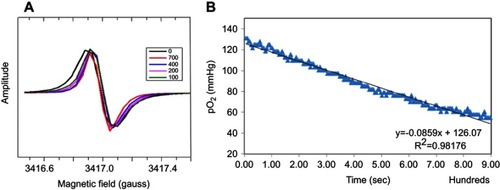
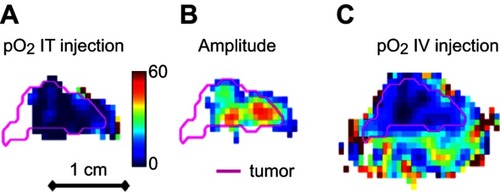
Figure 5 In vivo tumor oxygen images. Nude mice with LS-174T xenograft tumor on leg flank were used to monitor in vivo oxygen measurements. pO2 of tumor was first imaged by intravenously injected trityl. After half-hour washout, tumor mice were injected with 3.36 mg of FMSN-trityl and the intracellular pO2 levels were monitored by EPRI. Tumor outlines obtained from MRI were illustrated in pink. Color bar showed pO2 scale in the range 0–60 mmHg. (A) pO2 image measured from FMSN-trityl via IT injection. (B) Signal amplitude acquired from FMSN-trityl via IT injection. (C) pO2 image measured from trityl via IV injection.