Figures & data
Table 1 Characterization of DexbLG block copolymer
Figure 1 Synthesis schema for dextran and poly(DL-lactide-co-glycolide) block copolymer.
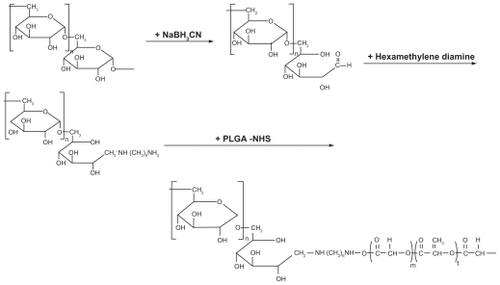
Figure 2 1H-NMR spectra of dextran and poly(DL-lactide-co-glycolide) block copolymer in dimethyl sulfoxide.
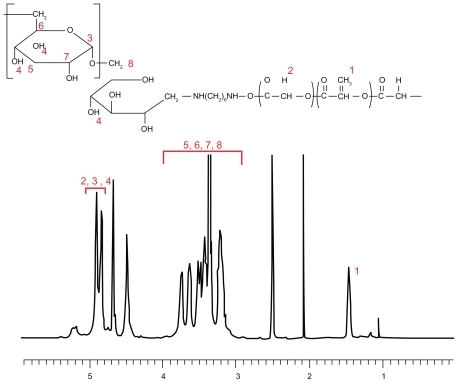
Table 2 Characterization of DexLG polymeric micelles incorporating doxorubicin
Figure 3 Transmission electron micrograph of polymeric micelles composed of dextran and poly(DL-lactide-co-glycolide) block copolymer.
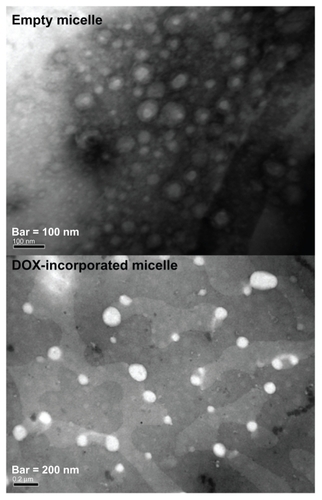
Figure 4 1H-NMR spectra of dextran and poly(DL-lactide-co-glycolide) polymeric micelle in D2O (A) and dimethyl sulfoxide (B).
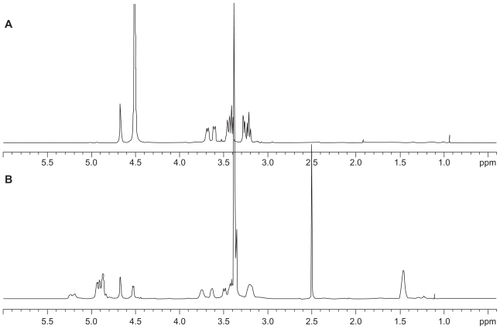
Figure 5 Fluorescence excitation of pyrene (6.0 × 10⁻⁷ M) versus the concentration of dextran and poly(DL-lactide-co-glycolide) copolymer in distilled water (λem = 390 nm) (A) plots of intensity ratios I339/I336 from the pyrene excitation spectra versus (B) log c of dextran and poly(DL-lactide-co-glycolide) copolymers in distilled water.
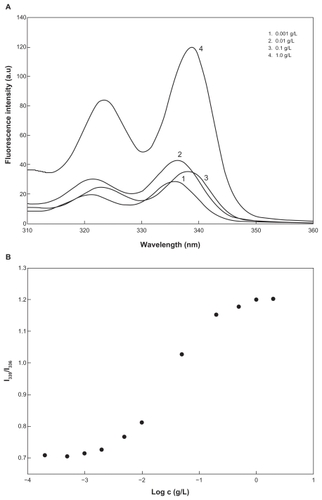
Figure 6 Drug release from polymeric micelles incorporating doxorubicin according to drug content.
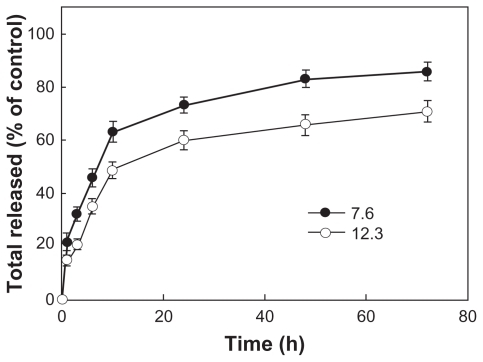
Figure 7 Growth inhibition of doxorubicin-sensitive (A) and doxorubicin-resistant (B) HuCC-T1 cells by treatment of polymeric micelles incorporating doxorubicin. 1 × 10⁴ cells were exposed to doxorubicin or polymeric micelles for 2 days. Empty polymeric micelles were treated in a similar way to (C). Empty polymeric micelles did not significantly inhibit cell growth rate.
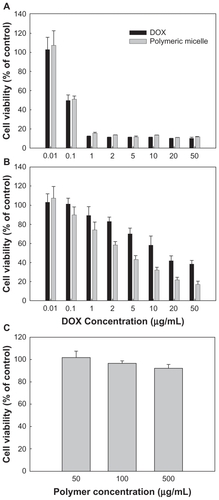
Figure 8 IC50 of doxorubicin and polymeric micelles against doxorubicin-resistant HuCC-T1 cells.
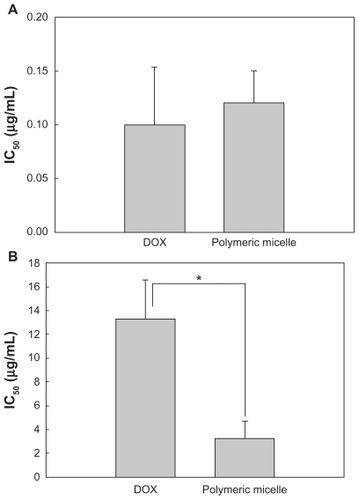
Figure 9 Fluorescence images of doxorubicin-sensitive and doxorubicin-resistant HuCCT1 cells. HuCCT1 cells were exposed to doxorubicin or polymeric micelles (equivalent concentration of doxorubicin 1 μg/mL) for 1 hour. Fluorescence images of cells were observed with confocal laser scanning microscopy.
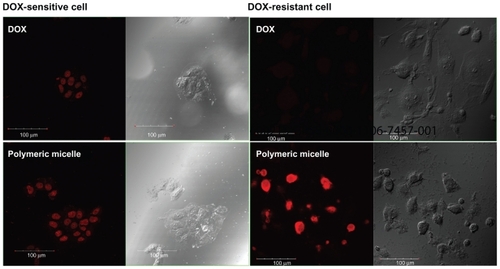
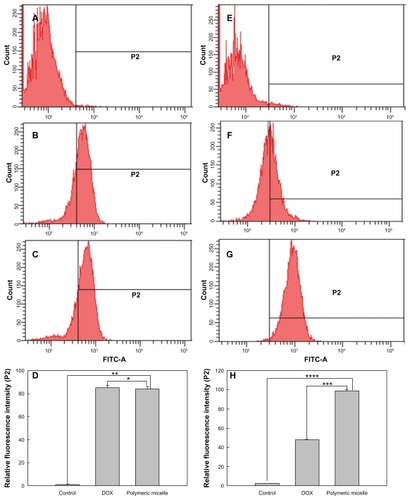
Figure 10 Flow cytometric analysis of doxorubicin-sensitive and doxorubicin-resistant HuCC-T1 cells. HuCCT1 cells were exposed to doxorubicin or polymeric micelles (equivalent concentration of doxorubicin 1 μg/mL) for 1 hour. 1 × 10⁶ cells were used for FACScan analysis. Doxorubicin-sensitive cells: (A) control, (B) doxorubicin, (C) polymeric micelles, (D) relative fluorescence intensity. Doxorubicin-resistant cells: (E) control; (F) doxorubicin; (G) polymeric micelles; (H) relative fluorescence intensity. The values were averaged over four separate experiments.
Notes: *P < 0.005; **P < 0.0001; ***P < 0.0001; ****P < 0.0001.