Figures & data
Figure 1 Reducing power potential and antioxidant activity of ES extract and optimization of ES-GNs. DPPH radical scavenging activity (A) and ABTS radical scavenging activity (B) of ES extract. UV-Vis spectroscopy analysis of ES extract (C) and green-synthesized ES-GNs (D). Optimization of ES extract concentration (E), gold(III) chloride (chloroauric acid) solution concentration (F), and reaction times (G) for ES-GN production.
Abbreviations: ES, Ephedra sinica Stapf; DPPH, 2,2-diphenyl-1-picrylhydrazyl; ABTS, 2,2′-azino-bis (3-ethylbenzothiazoline-6-sulphonic acid); ES-GNs, ES extract–gold nanoparticles; UV-Vis, ultraviolet-visible.
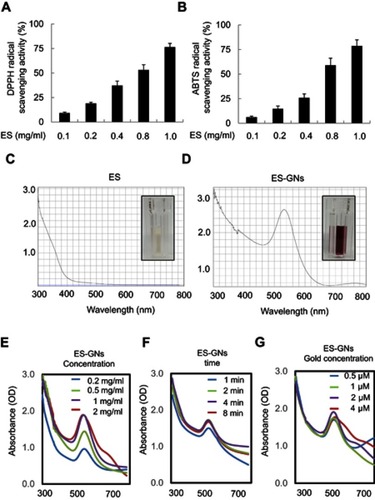
Figure 2 DLS and HR-TEM images of ES-GNs showing the SAED pattern, HAADF, and EDS. The hydrodynamic size (A) and zeta potential (B) of ES-GNs were determined by DLS. (C–D) Particle shape of ES-GNs was confirmed by low- and high-magnification images and HR-TEM images. The SAED pattern (E), HAADF image (F, G), and EDS analysis (H) of ES-GNs.
Abbreviations: DLS, dynamic light scattering; HR-TEM, high-resolution transmission electron microscopy; SAED, selected area electron diffraction; HAADF, high-angle annular dark field; EDS, energy dispersive spectroscopy.
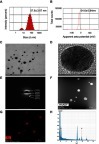
Figure 3 XRD and FT-IR spectra of ES-GNs. XRD patterns of ES extract (A) and synthesized ES-GNs (B). FT-IR spectra of ES extract (C) and synthesized ES-GNs (D).
Abbreviations: XRD, X-ray diffraction; FT-IR, Fourier transform-infrared spectroscopy.
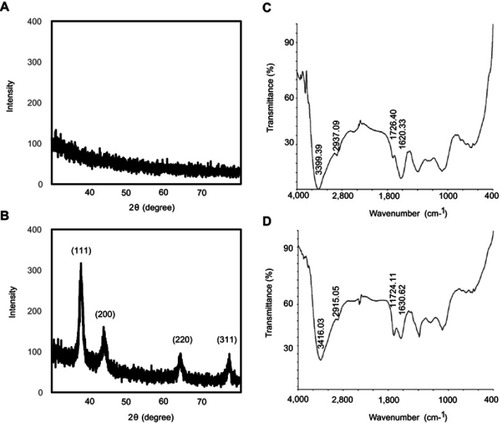
Figure 4 Effect of ES extract and ES-GNs on microglia viability and pro-inflammatory cytokine production. Primary microglia (A) and BV-2 microglia cell viability (B) were determined using the MTT assay. Primary microglia (C) and BV-2 microglia cell cytotoxicity (D) were analyzed using the LDH assay. (E, F) The production of TNF-α, IL-1β, and IL-6 in the culture media was analyzed using a commercial ELISA kit. ROS content was determined using CM-H2DCFDA. # P<0.01 relative to the control group. *P<0.05 and **P<0.01 relative to the LPS-treated group.
Abbreviations: ES, Ephedra sinica; LDH, lactate dehydrogenase; TNF-α, tumor necrosis factor-α.
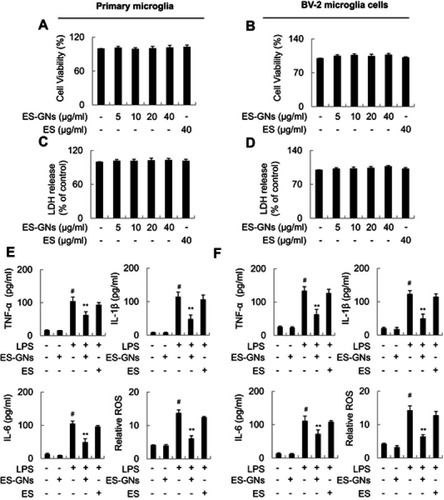
Figure 5 Effect of ES-GNs on iNOS and COX-2 activity via the IKK-α/β, NF-κB, JAK/STAT, ERK-1/2, p38 MAPK, JNK, and PLD signaling pathways in BV-2 microglia cell. NO content (A) was measured using the Griess reaction. PGE2 (B) was measured using a commercial ELISA kit. The relative mRNA levels encoding iNOS (C) and COX-2 (D) were determined by real-time RT-PCR. Dual luciferase assay was performed to evaluate iNOS (E) and COX-2 (F) promoter activity. (G) Western blotting and semi-quantitative analysis were performed to estimate iNOS, COX-2, and α-tubulin protein levels. (H) Western blot analysis and semi-quantitative analysis were performed to evaluate the protein expression of p-IKK-α/β, IKK-α/β, p-IκB-α, IκB-α, and α-tubulin. (I) Western blot analysis and semi-quantitative analysis were performed to evaluate the protein expression of NF-κB p65, p-NF-κB p65, and TBP. (J) Dual luciferase assay was performed to evaluate NF-κB p65 promoter binding activity. (K) Western blotting and semi-quantitative analysis were performed to estimate protein levels of p-JAK-1, p-STAT-1, JAK-1, and STAT-1. (L) Western blotting and semi-quantitative analysis were performed to estimate the protein expression of p-ERK, p-JNK, p-p38, ERK, JNK, and p38. (M) Amplex Red PLD assay kit was used to estimate the PLD activity. # P<0.01 relative to the control group. *P<0.05 and **P<0.01 relative to the LPS-treated group.
Abbreviations: NO, nitrite; PGE2, prostaglandin E2; iNOS, inducible nitric oxide synthase; COX-2, cyclooxygenase; p-, phosphorylated; IKK, IκB kinase; TBP, TATA-binding protein; JAK, Janus-activated kinase; STAT, signal transducers and activators of transcription; ERK, extracellular signal-regulated kinase; JNK, c-JUN N-terminal kinase; PLD, phospholipase D.
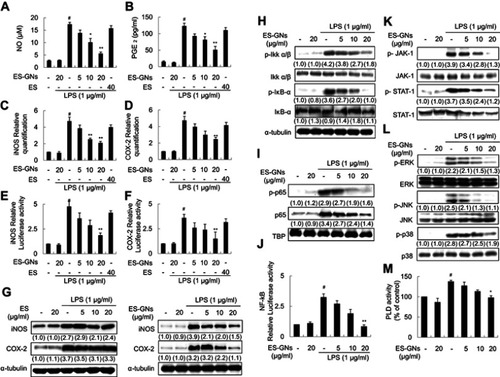
Figure 6 Effect of ES-GNs on anti-neuroinflammatory properties through the AMPK/Nrf2/ARE signaling pathway in BV-2 microglia cell. (A) Western blot and semi-quantitative analysis were performed to evaluate the protein expression levels of HO-1 and α-tubulin. (B) BV-2 microglia cells were transfected with HO-1 siRNA and treated 20 μg/mL ES-GNs followed by LPS and analyzed for HO-1 and α-tubulin protein levels. (C) BV-2 microglia cells were transfected with HO-1 siRNA and treated 20 μg/mL ES-GNs followed by LPS and analyzed for iNOS promoter activity. (D) NQO1 and α-tubulin protein levels were assessed by western blotting. (E) After transfection with NQO1 siRNA were pre-treated with 20 μg/mL ES-GNs and treated with LPS. NQO1 siRNA system was performed to evaluate the protein expression levels of NQO1 and α-tubulin. (F) After transfection with NQO1 siRNA were pre-treated with 20 μg/mL ES-GNs and treated with LPS. Dual luciferase assay was performed to evaluate iNOS promoter activity in NQO1 siRNA system. (G) Western blotting and semi-quantitative analysis were performed to evaluate Nrf2 and TBP protein levels. (H) After transfection with Nrf2 siRNA were pre-treated with 20 μg/mL ES-GNs and treated with LPS. Nrf2 siRNA system was performed to evaluate Nrf2, HO-1, NQO1, TBP, and α-tubulin protein levels. (I) After transfection with Nrf2 siRNA were pre-treated with 20 μg/mL ES-GNs and treated with LPS. Dual luciferase assay was performed to evaluate iNOS promoter activity in Nrf2 siRNA system. (J) Western blotting and semi-quantitative analysis were performed to evaluate p-AMPK and AMPK protein levels. (K) After transfection with AMPK siRNA were pre-treated with 20 μg/mL ES-GNs and treated with LPS. AMPK siRNA system was performed to evaluate p-AMPK, AMPK, Nrf2, HO-1, NQO1, TBP, and α-tubulin protein levels. (L) After transfection with AMPK siRNA were pre-treated with 20 μg/mL ES-GNs and treated with LPS. Dual luciferase assay was performed to evaluate iNOS promoter activity in the AMPK siRNA system. # P<0.01 relative to the control group. *P<0.05 and **P<0.01 relative to the LPS-treated group.
Abbreviations: HO-1, heme oxygenase-1; NQO1, NAD(P)H dehydrogenase1; Nrf2, nuclear erythroid 2-related factor 2; TBP, TATA-binding protein; si, small interfering; AMPK, AMP-activated protein kinase.
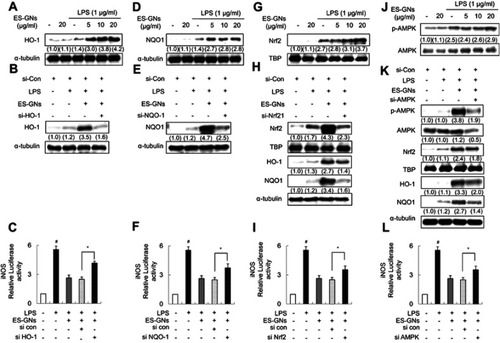
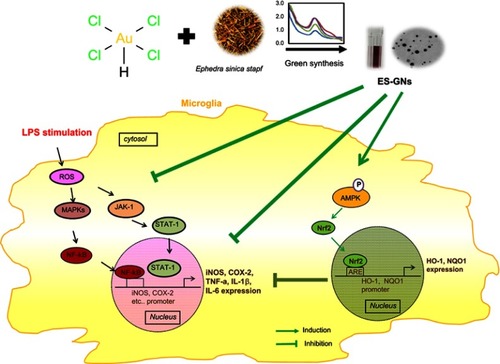
Figure 7 Scheme illustrating the anti-neuroinflammatory properties of ES-GNs in microglia.
Abbreviations: ES-GN, Ephedra sinica Stapf extract–gold nanoparticle; TNF-α, tumor necrosis factor-α; iNOS, Inducible nitric oxide synthase; COX-2, cyclooxygenase; p-, phosphorylated; Ikk, IĸB kinase; TBP, TATA-binding protein; JAK, Janus kinase; STAT, signal transducer of activation; MAPKs, Mitogen-activated protein kinases; HO-1, heme oxygenase-1; NQO1, NAD(P)H dehydrogenase1; Nrf2, nuclear factor erythroid-derived 2-related factor 2; TBP, TATA-binding protein; AMPK, AMP-activated protein kinase.