Figures & data
Table S1 Optical parameters of gold quantum dots (GQDs) with different type of cells (GQDs-T98G, GQDs-SNU-80, GQDs-H460, GQDs-HEK293, GQDs-MRC-5)
Table S2 Optical parameters of gold nanoparticles with different type of cells (GNPs-10-T98G, GNPs-10-SNU-80, GNPs-10-H460, GNPs-10-HEK293, and GNPs-10-MRC-5)
Table S3 Optical parameters of gold nanoparticles with different type of cells (GNPs-25-T98G, GNPs-25-SNU-80, GNPs-25-H460, GNPs-25-HEK293, and GNPs-25-MRC-5)
Table S4 Optical parameters of gold nanoparticles with different type of cells (GNPs-50-T98G, GNPs-50-SNU-80, GNPs-50-H460, GNPs-50-HEK293, and GNPs-50-MRC-5)
Figure 1 X-ray diffraction patterns of DS-GNPs.
Note: (A) GQDs (4–5 nm), (B) GNPs (10–15 nm), (C) GNPs (20–30 nm), (D) GNPs (40–45 nm).
Abbreviations: GQD, gold quantum dot; GNP, gold nanoparticle.
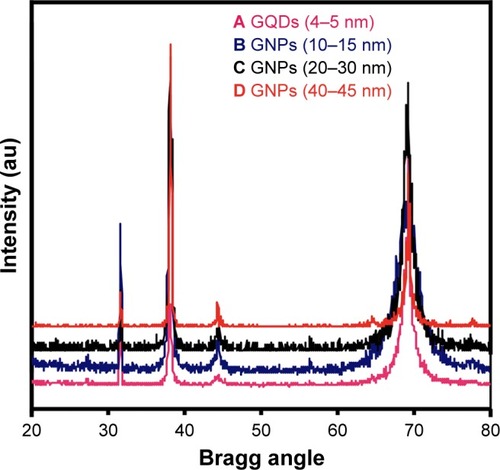
Figure 2 MVS-GNP images of synthesized GQDs and GNPs.
Notes: (A, C, E, and G) show the various sizes of the GQDs: (A, <10 nm) and GNPs (C, E, and F, 10–15, 20–30, and 45–50 nm, respectively), whereas (B, D, F, and H) show HR-TEM images depicting the differences between the two lattice fringes, which are in the range of ~0.233 to ~0.236 nm, respectively. The HR-TEM observations indicate the crystallinity of the synthesized products.
Abbreviations: GQD, gold quantum dot; GNP, gold nanoparticle; HR-TEM, high-resolution transmission electron microscopy.
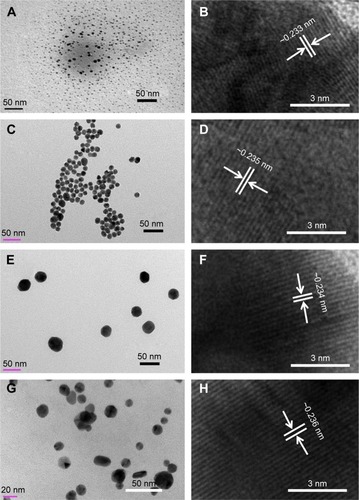
Figure 3 GQDs suppress the viability of glioma spheroids more efficiently than GNPs.
Notes: (A and B) MTT viability assays of U87 and U373 glioma spheroids, respectively. Viability was measured at 24 hours after a treatment with various sizes of GQDs (<5 nm) and GNPs (10–50 nm) at different concentrations (5–100 nM). (C and D) Intracellular ATP measurements in U87 and U373 glioma spheroids, respectively, with treatment with various sizes of GQDs and GNPs at a 50 nM concentration at 24 hours. Significance was calculated compared to controls and these levels are presented as *P<0.05, **P<0.01, and ***P<0.001. Nonsignificance is denoted as NS.
Abbreviations: GQD, gold quantum dot; GNP, gold nanoparticle.
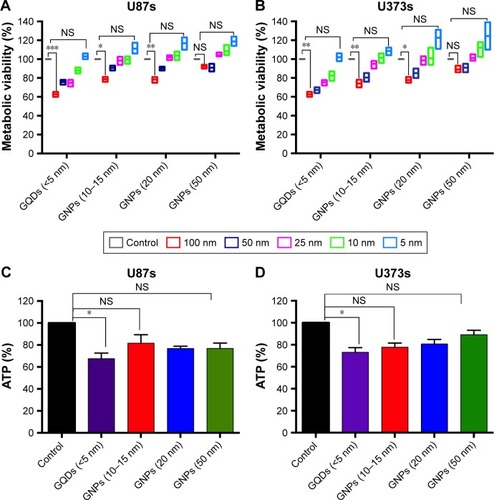
Figure 4 GQDs decrease the aggressiveness of glioma cells.
Notes: (A and B) 2D migration and invasion assays were performed in U87 cells via Transwell assays stained at 24 hours after a treatment of <5 nm GQDs at a 100 mM concentration. (C and D) Immunoblotting and RT-qPCR detection for EMT markers, in this case e-cadherin (CDH1), n-cadherin (CDH2), fibronectin (FN), and vimentin (VIM) in <5 nm G-QDs under conditions identical to those described above in U87 glioma cells. β-Actin was used as a control for normalization. (E) Expression levels of CDH2 were visualized by immunofluorescence staining. Typical images of <5 nm GQDs (100 nM) treated and untreated in identical glioma cells were photographed at 20× magnification. Scale bar =10 µm. Significance levels were calculated compared to the controls and are presented as *P<0.05, **P<0.01, <0.001. Nonsignificance is denoted as NS.
Abbreviations: GQD, gold quantum dot; GNP, gold nanoparticle; EMT, epithelial–mesenchymal transition.
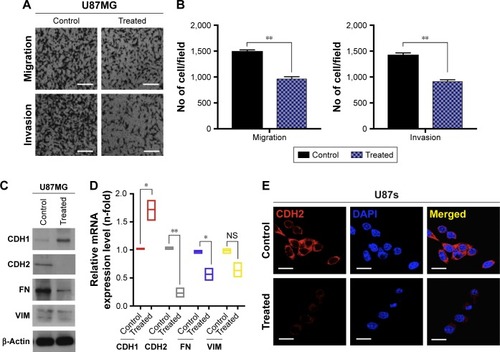
Figure 5 The self-renewal ability was inhibited after exposure to GQDs in glioma spheroids.
Notes: (A and B) A sphere-forming assay was performed until 0–4 days 24 hours following a treatment of <5 nm GQDs at a 100 nM concentration in U87 glioma spheroids. The representative graph shows the size of the formed spheres after the treatment according to Motic Images Plus software. (C and D) RT-qPCR analysis outcomes of stem-cell-like markers of CD133, OCT4, SOX2, Musashi-1, Nestin, and β-catenin (CTNNB1) in treated and untreated spheroids in panel A. β-Actin was used as a control for normalization. (E) Co-relation analysis results of CD133 (highly expressed specifically in glioma stem cells) and CTNNB1 using a publically available TCGA data set online tool. Scale bar =100 µm. *P<0.05; **P<0.01; ***P<0.001. Nonsignificance is denoted as NS.
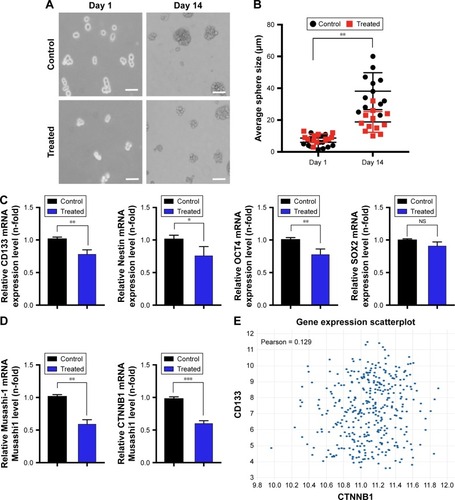
Figure 6 β-Catenin overexpression diminished the effect of GQDs on the reduction of malignancy in glioma spheroids.
Notes: (A) Viability of U87s glioma spheroids after EV (pCMV6 empty vector) and pCMV6-XL5 (CTNNB1) overexpression. (B) Sphere-forming assay of U87s glioma spheroids after EV and CTNNB1 overexpression. The table shows the total number of spheres which formed after each treatment. (C) Migration of U87 glioma cells after EV CTNNB1 overexpression. (D) RT-qPCR of U87 glioma cells after EV and CTNNB1 overexpression. <5 nm GQDs were treated at a 100 nM concentration in each panel and a similar treatment condition was maintained throughout all experiments. β-Actin was used as a control for normalization. Scale bar =20 µm. *P<0.05; **P<0.01; Nonsignificance is denoted as NS.
Abbreviation: GQD, gold quantum dot.
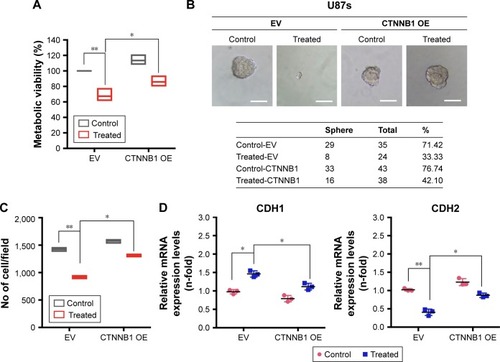
Figure S1 Size distribution of prepared gold QDs (~4.34 nm [], poly disparitŷ19%) with ImageJ software.
Abbreviation: QD, quantum dot.
![Figure S1 Size distribution of prepared gold QDs (~4.34 nm [Figure 2A], poly disparitŷ19%) with ImageJ software.Abbreviation: QD, quantum dot.](/cms/asset/7d4e3920-54d8-43d9-92b1-6b20a20730c5/dijn_a_12190777_sf0001_c.jpg)
Figure S2 The absorption spectra of MVS-GNPs: quantum dots (<10 nm) (A) NPs (10–15 nm) (B), NPs (20–30 nm) (C), and NPs (45–50 nm) (D) with cancer (T98G, SNU-80, H-460) and non-cancerous (HEK293, MRC-5) cells.
Abbreviations: MVS, multivariant-sized; GNP, gold nanoparticle; NP, nanoparticle.
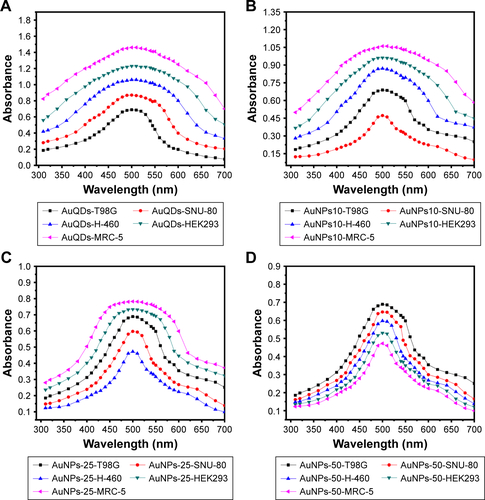
Figure S3 Linear calibration graph of (A) GQDs with T98G, SNU-80, H-460, HEK293, and MRC-5 cells, (B) GNPs (10–15 nm) with T98G, SNU-80, H-460, HEK293, and MRC-5 cells, (C) GNPs (20–30 nm) with T98G, SNU-80, H-460, HEK293, and MRC-5 cells, and (D) GNPs (45–50 nm) with T98G, SNU-80, H-460, HEK293, and MRC-5 cells, respectively.
Abbreviations: GQD, gold quantum dot; GNP, gold nanoparticle.
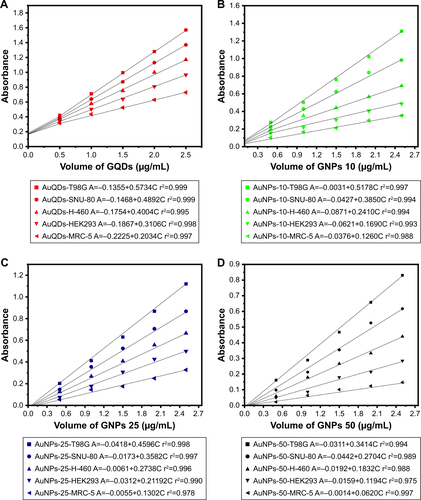
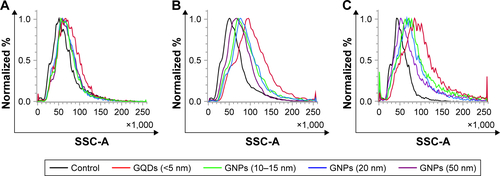
Figure S4 Flow cytometry side scattering intensity (SSC-A) histograms of U87 glioma cells exposed to GQDs (<5 nm), GNPs (10–15 nm), GNPs (20 nm), and GNPs (50 nm) at 100 nM concentrations at 4 hours (A), 12 hours (B), and 24 hours (C) incubation time.
Abbreviations: GQD, gold quantum dot; GNP, gold nanoparticle.