
Figures & data
Table 1 Results of different dispersion methods and parameters
Figure 1 Transmission electron microscopic analysis of the morphology of the LNPs. (A) At a magnification of 22,500×; (B) at a magnification of 20,500×.
Abbreviation: LNPs, lipid nanoparticles.
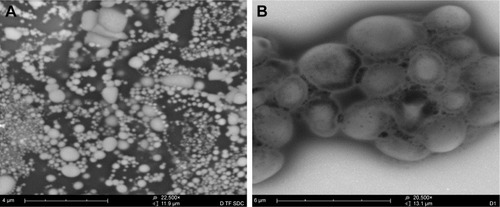
Table 2 Characteristics of common liposomes/nanoparticles/LNPs
Figure 2 Size distribution of the nanoparticles and LNPs: (A) nanoparticles; (B) LNPs.
Abbreviation: LNPs, lipid nanoparticles.
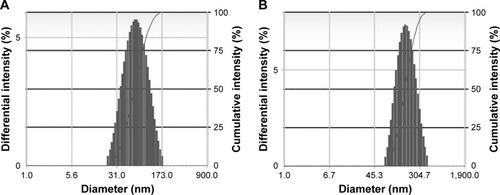
Table 3 Preliminary stability of LNPs under different conditions
Figure 3 Transdermal permeation curve of aqueous suspensions, common liposomes, and LNPs in vitro.
Abbreviations: TAA, aqueous suspensions; LPs, common liposomes; LNPs, lipid nanoparticles.
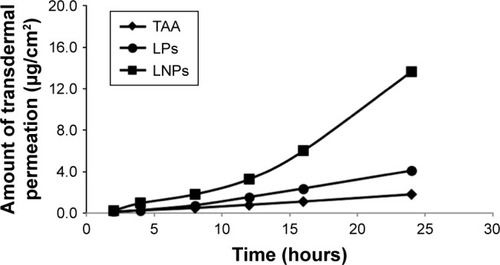
Figure 4 Fluorescence distribution of rhodamine-B in scar tissue in rabbit ears. (A1, A2, A3) LNPs group at 4, 8, and 12 hours, respectively; (B1, B2, B3) the control group at 4, 8, and 12 hours, respectively.
Abbreviation: LNPs, lipid nanoparticles.
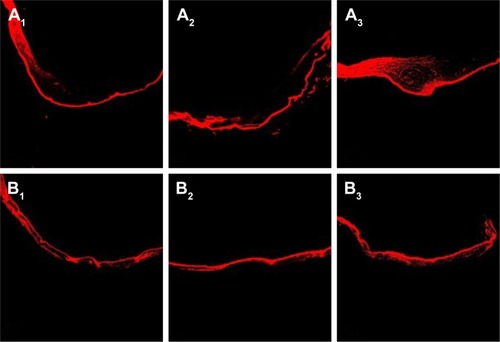
Figure 5 Fluorescence density of rhodamine-B in scar tissue in rabbit ears after 4–12 hours.
Abbreviations: TAA, aqueous suspensions; LNPs, lipid nanoparticles.
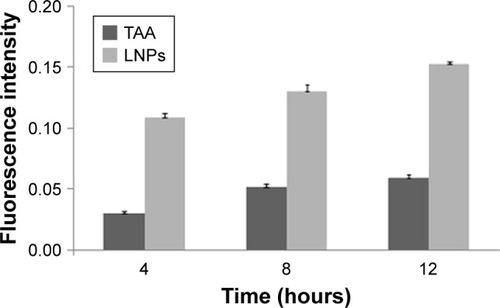
Figure 6 Overall observation of scarring after surgery.
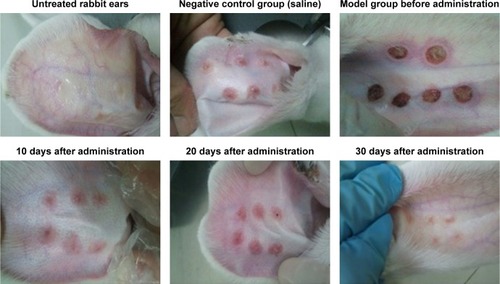
Figure 7 HE-stained slices of rabbit ears obtained from different groups treated with HSs (4×10).
Abbreviations: HE, hematoxylin; HSs, hypertrophic scars.
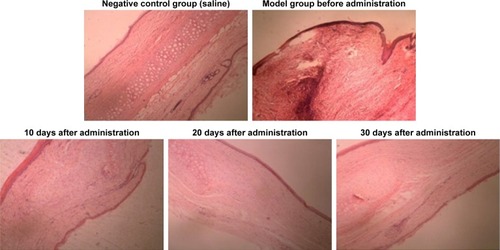
Figure 8 The VG-stained slices of rabbit ears obtained from different groups treated with HSs (4×10).
Abbreviations: VG, Van Gieson’s solution; HSs, hypertrophic scars.
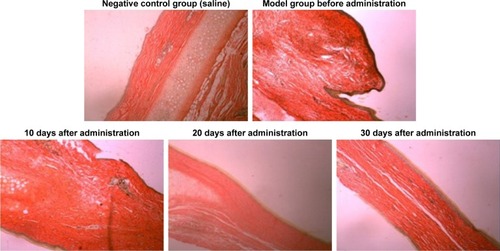
Figure 9 Various index values of scar tissue observed after administration.
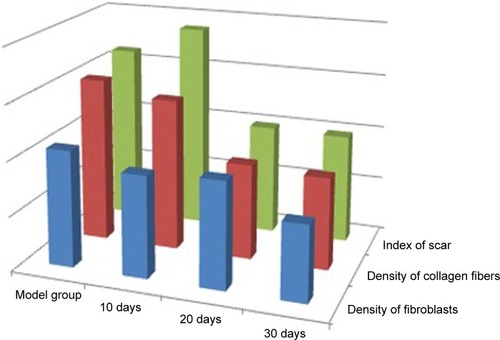
Table 4 Scores of single skin irritation tests performed using TAA-LNPs
Table 5 Scores of multiple skin irritation tests performed with TAA-LNPs