Figures & data
Figure 1 Characterization of PLGA-NPs. (A) Representative SEM images of spherical PLGA-NPs and ellipsoidal PLGA-NPs generated on-site. (B) Size distribution of spherical PLGA-NPs and PEI-modified spherical PLGA-NPs. (C) 1H-NMR spectrums of ellipsoidal PLGA-NPs and PEGylated ellipsoidal PLGA-NPs in CDCl3. (D) Zeta potential distributions of PLGA-NPs and aAPCs.
Abbreviations: S-NP, spherical NPs without surface modification; S-NPPEI, PEI-modified spherical NPs; E-NP, ellipsoidal NPs without surface modification; E-NPPEI, PEI-modified ellipsoidal NPs; E-NPPEG, PEGylated ellipsoidal NPs; E-NPPEG/PEI, PEI-modified and PEGylated ellipsoidal NPs; PLGA-NP, polylactic-co-glycolic acid nanoparticle; aAPC, artificial antigen-presenting cell; SEM, scanning electron microscopy; SaAPC, nanospherical aAPCs; EaAPC, nanoellipsoidal aAPC; EaAPCPEG, PEGylated nanoellipsoidal aAPC; NP, nanoparticle; PEI, polyethyleneimine; EaAPCPEG/CD47, PEGylated and CD47-conjugated nanoellipsoidal aAPCs.
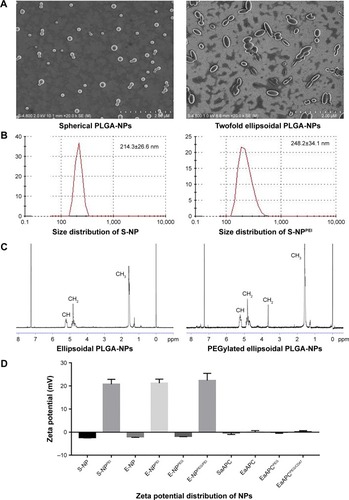
Figure 2 Schematic illustration of the fabrications of SaAPC, EaAPC, EaAPCPEG, and EaAPCPEG/CD47.
Abbreviations: SaAPC, nanospherical aAPCs; EaAPC, nanoellipsoidal aAPC; EaAPCPEG, PEGylated nanoellipsoidal aAPC; NP, nanoparticle; PLGA, polylactic-co-glycolic acid; PEI, polyethyleneimine; EaAPCPEG/CD47, PEGylated and CD47-conjugated nanoellipsoidal aAPCs; PEG, poly(ethylene glycol).
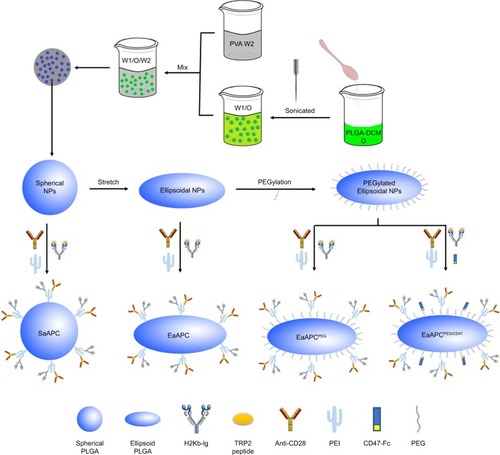
Figure 3 Phenotypic analyses of aAPCs by flow cytometry. Blank-NPs, SaAPC, EaAPC, EaAPCPEG, and EaAPCPEG/CD47 were generated in parallel, and followed by fluorescence staining with FITC-anti-hamster IgG (binding to anti-CD28), PE-anti-mouse H-2Kb (binding to H-2Kb/TRP2-Ig), and/or APC-anti-human IgG1 (binding to CD47-Fc). Blank-NPs were pre-blocked with BSA. (A) Flow cytometric histograms for each type of aAPCs and Blank-NPs. (B) Flow cytometric dot plots for each type of aAPCs and Blank-NPs in a two-color manner with the percentage of double-positive aAPCs in the upper right quadrant.
Abbreviations: SaAPC, nanospherical aAPCs; EaAPC, nanoellipsoidal aAPC; EaAPCPEG, PEGylated nanoellipsoidal aAPC; NP, nanoparticle; aAPC, artificial antigen-presenting cell; EaAPCPEG/CD47, PEGylated and CD47-conjugated nanoellipsoidal aAPCs.
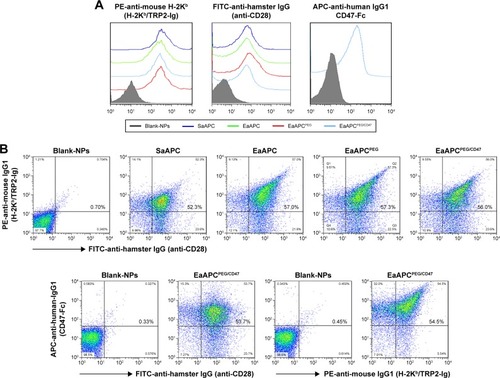
Figure 4 EaAPCPEG/CD47 markedly reduced cellular uptake by macrophage in vitro and expanded naïve TRP2180-188-specific CD8+ T cells ex vivo. PE-labeled SaAPC, EaAPC, EaAPCPEG, and EaAPCPEG/CD47 were prepared and co-cultured with RAW 264.7 cells for 6 hours. Blank-NPs without PE labeling were used as negative control. (A) Confocal images of RAW 264.7 cells after DAPI staining in each co-culture. (B) Flow cytometric histograms of the PE-positive RAW 264.7 cells in each co-culture. (C) The mean fluorescence intensity of PE-positive RAW 264.7 cells in each co-culture. The results were collected from three independent experiments and expressed as mean ± SD. Naïve spleen lymphocytes from C57BL/6J mice were co-incubated for 8 days with Blank-NPs, SaAPC, EaAPC, EaAPCPEG, or EaAPCPEG/CD47. (D) The frequencies of TRP2180-188-specific CD8+ T cells in each co-culture group, as detected by TRP2180-188-dimer staining. (E) Statistical analyses for the percentages of TRP2180-188-specific CD8+ T cells across co-culture groups. The data were collected from three independent experiments and expressed as mean ± SD. *P<0.05, **P<0.01, ***P<0.001, ****P<0.0001.
Abbreviations: SaAPC, nanospherical aAPCs; EaAPC, nanoellipsoidal aAPC; EaAPCPEG, PEGylated nanoellipsoidal aAPC; NP, nanoparticle; aAPC, artificial antigen-presenting cell; EaAPCPEG/CD47, PEGylated and CD47-conjugated nanoellipsoidal aAPCs; MFI, mean fluorescence intensity.
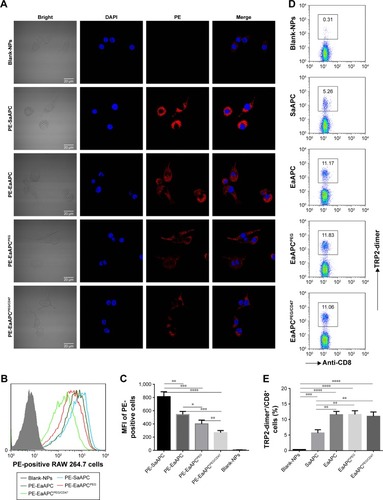
Figure 5 EaAPCPEG/CD47 markedly reduced co-localizations with phagocytes and increased contacts with CD8+ T cells in vivo. PE-labeled SaAPC, EaAPC, EaAPCPEG, EaAPCPEG/CD47, or Blank-NPs (sphere) were i.v. injected into the melanoma-bearing C57BL/6 mice on day 11. Six hours later, spleens were collected from each group and frozen sections were prepared. Then, CD4+ T cells, CD8+ T cells, B cells, macrophages, and DCs were stained with FITC-labeled mAbs, respectively, and observed by confocal imaging in the spleen sections at 400× magnification. White arrow points at the co-localizations of PE-aAPCs (or PE-Blank-NPs) with indicated cells.
Abbreviations: DC, dendritic cell; SaAPC, nanospherical aAPCs; EaAPC, nanoellipsoidal aAPC; EaAPCPEG, PEGylated nanoellipsoidal aAPC; NP, nanoparticle; aAPC, artificial antigen-presenting cell; i.v., intravenous; EaAPCPEG/CD47, PEGylated and CD47-conjugated nanoellipsoidal aAPCs.
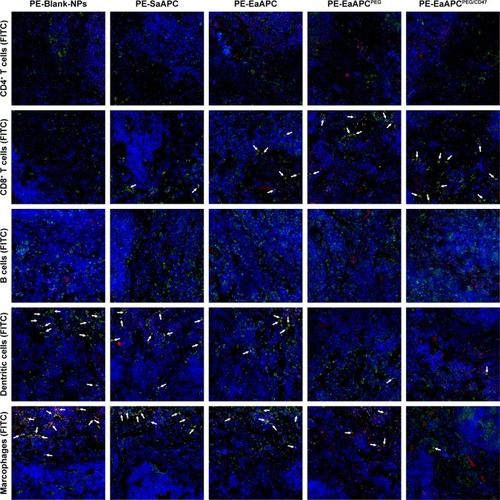
Figure 6 EaAPCPEG/CD47 significantly reduced cellular uptake by phagocytes and increased contacts with CD8+ T cells in vivo. Spleens were collected from melanoma mice at 6 hours after i.v. injection of PE-labeled aAPCs or Blank-NPs. Then the single-cell suspensions were prepared and stained with FITC-labeled mAbs specific for CD4+ T cells, CD8+ T cells, B cells, DCs, and macrophages and followed by quantitative analyses of flow cytometry. The number in top quadrant represents the percentage of PE+/FITC+ signals (presumably aAPC-T-cell conjugates or phagocytes intaking aAPCs) in the spleen cell suspension. Significant differences across groups were statistically analyzed. n=3 in each treatment group. *P<0.05, **P<0.01, ***P<0.001, ****P<0.0001.
Abbreviations: DC, dendritic cell; SaAPC, nanospherical aAPCs; EaAPC, nanoellipsoidal aAPC; EaAPCPEG, PEGylated nanoellipsoidal aAPC; NP, nanoparticle; aAPC, artificial antigen-presenting cell; i.v., intravenous; EaAPCPEG/CD47, PEGylated and CD47-conjugated nanoellipsoidal aAPCs.
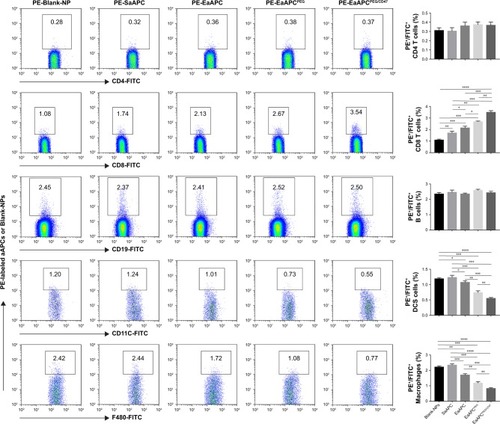
Figure 7 EaAPCPEG/CD47 markedly inhibited melanoma growth after in vivo injections. C57BL/6J mice were injected s.c. with B16 cells on day 0, then randomized into five groups and infused i.v. with SaAPC, EaAPC, EaAPCPEG, EaAPCPEG/CD47, or Blank-NPs (sphere) on days 7, 9, and 11. (A) Timeline for in vivo experiments, (B) subcutaneous melanoma growth (n=5), (C) melanoma tissues at endpoint (day 28, n=5), (D) Kaplan–Meier survival curves of melanoma-bearing mice (n=7) in each treatment group, and (E) statistical analyses for the differences across groups using a log-rank comparison for MST, Wilcoxon signed-rank tests for tumor growth curves, and two-tailed unpaired Student’s t-test for tumor sizes at endpoint. The presented data were from one representative experiment of two independent experiments. *P<0.05, **P<0.01, ***P<0.001, ****P<0.0001.
Abbreviations: SaAPC, nanospherical aAPCs; EaAPC, nanoellipsoidal aAPC; EaAPCPEG, PEGylated nanoellipsoidal aAPC; NP, nanoparticle; aAPC, artificial antigen-presenting cell; i.v., intravenous; s.c., subcutaneous; MST, median survival time; EaAPCPEG/CD47, PEGylated and CD47-conjugated nanoellipsoidal aAPCs.
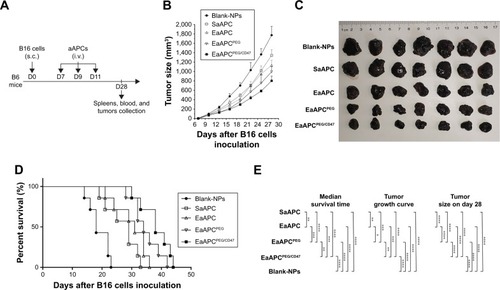
Figure 8 EaAPCPEG/CD47 markedly augmented melanoma antigen-specific CTL responses in melanoma-bearing mice. On day 28 (17 days after final infusion of aAPCs or Blank-NPs), TRP2180-188-specific CTLs were detected in peripheral blood, spleens, and tumors for each treatment group, by TRP2-dimer staining and flow cytometry. The percentages of TRP2180-188-specific CTLs in the CD8+ T-cell populations in PBMCs (A), spleen lymphocytes (B), and the cells suspensions derived from melanoma tissues (C) were presented, along with the statistical analyses of differences across groups using a two-tailed, unpaired Student’s t-test; n=5; *P<0.05, **P<0.01, ***P<0.001, and ****P<0.0001.
Abbreviations: CTL, cytotoxic T lymphocyte; NP, nanoparticle; aAPC, artificial antigen-presenting cell; PBMC, peripheral blood mononuclear cell; EaAPCPEG, PEGylated nanoellipsoidal aAPC; SaAPC, nanospherical aAPCs; EaAPC, nanoellipsoidal aAPC; EaAPCPEG/CD47, PEGylated and CD47-conjugated nanoellipsoidal aAPCs.
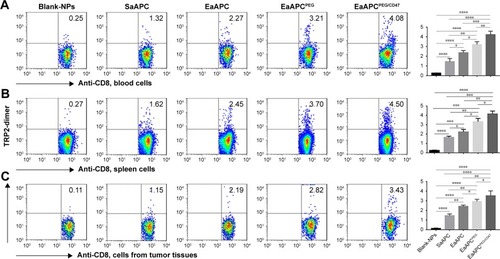
Figure 9 EaAPCPEG/CD47 caused extensive local infiltration of antigen-specific CTLs in melanoma tissues. On day 28 (17 days after final infusion of aAPCs or Blank-NPs), the melanoma tissues were collected from each treatment group, embedded in paraffin and sectioned, then followed by in situ TRP2-dimer staining (mixture of TRP2-dimer with PE-anti-mouse IgG1) and FITC-anti-mouse CD8a staining. After DAPI staining, the CD8+/TRP2-dimer+ cells were visualized by confocal laser scanning in the tumor sections. Representative images from three individual mice per group were presented at 400× magnification.
Abbreviations: CTL, cytotoxic T lymphocyte; NP, nanoparticle; aAPC, artificial antigen-presenting cell; EaAPCPEG, PEGylated nanoellipsoidal aAPC; SaAPC, nanospherical aAPCs; EaAPC, nanoellipsoidal aAPC; EaAPCPEG/CD47, PEGylated and CD47-conjugated nanoellipsoidal aAPCs.
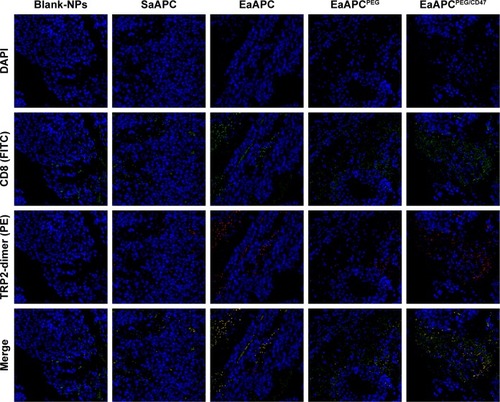
Figure 10 EaAPCPEG/CD47 caused extensive necrosis and apoptosis in melanoma tissues and increased IFN-γ-producing CTLs in spleens. On day 28 (17 days after final infusion of aAPCs or Blank-NPs), the melanoma tissues were collected from each treatment group, embedded in paraffin and sectioned, then followed by H&E staining and TUNEL fluorescence staining. Representative images from three individual mice per group were presented at 400× magnification. The positive cells in TUNEL staining were quantified using Image J software. Five fields were measured for each image, along with statistical analyses across groups. On day 14, spleen lymphocytes were collected from each mouse, co-cultured with TRP2180-188 peptide for 21 hours, and followed by intracellular IFN-γ staining. The percentages of IFN-γ+/CD8+ T cells were analyzed by flow cytometry, along with the statistical analyses of differences across groups; n=3; *P<0.05, **P<0.01, ***P<0.001, and ****P<0.0001.
Abbreviations: CTL, cytotoxic T lymphocyte; NP, nanoparticle; aAPC, artificial antigen-presenting cell; EaAPCPEG, PEGylated nanoellipsoidal aAPC; IFN, interferon; SaAPC, nanospherical aAPCs; EaAPC, nanoellipsoidal aAPC; EaAPCPEG/CD47, PEGylated and CD47-conjugated nanoellipsoidal aAPCs.
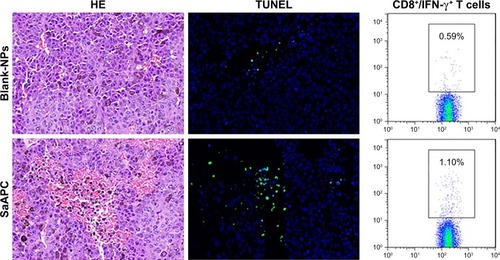
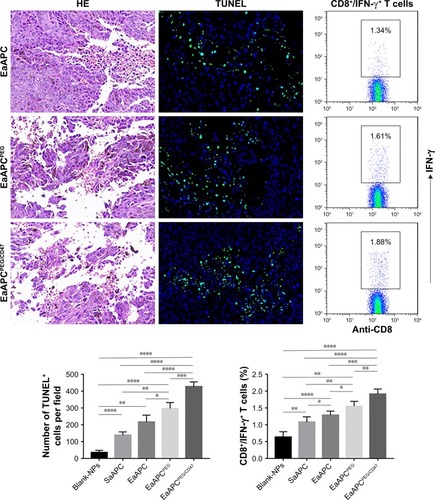
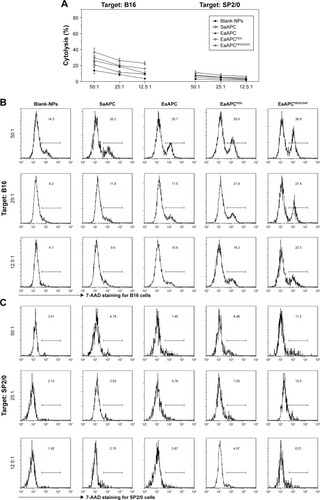
Figure 11 EaAPCPEG/CD47 significantly enhanced the cytotoxicity of melanoma antigen-specific CTLs in melanoma mice. On day 14, spleen lymphocytes were collected from each mouse after three infusions of aAPCs or Blank-NPs, and used as effector cells to co-culture with mouse melanoma cell line B16 or myeloma cell line SP2/0 for 4 hours at various E:T ratios, and followed by 7-AAD staining to analyze the antigen-specific cytolysis of B16 and SP2/0 tumor cells. (A) the cytotoxicity of splenocytes against B16 and SP2/0 cells. The representative flow cytometric histograms of 7-AAD staining for B16 cells (B) and SP2/0 cells (C) were presented; n=3 in each group.
Abbreviations: CTL, cytotoxic T lymphocyte; 7-AAD, 7-amino-actinomycin D; NP, nanoparticle; aAPC, artificial antigen-presenting cell; EaAPCPEG, PEGylated nanoellipsoidal aAPC; SaAPC, nanospherical aAPCs; EaAPC, nanoellipsoidal aAPC; EaAPCPEG/CD47, PEGylated and CD47-conjugated nanoellipsoidal aAPCs.