Figures & data
Table 1 Formulation formulae and values of evaluation parameters of all formulation batches
Figure 1 Scanning electron microscopy photographs of microparticles from formulation batches (A) F1, (B) F3, and (C) F5.
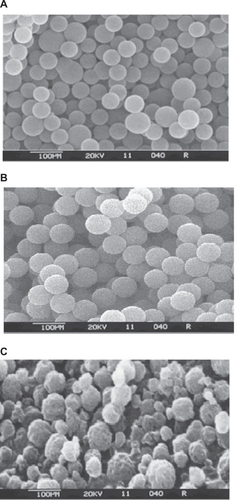
Figure 2 Histogram of mean particle size distribution of all formulation batches.
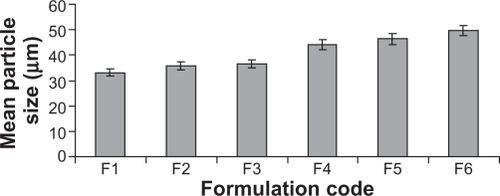
Figure 3 Zeta potential report of uncoated microparticles from formulation batch F1.
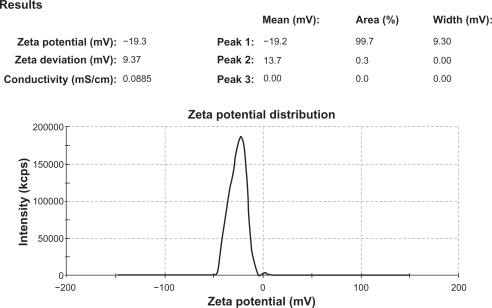
Figure 4 Comparative in vitro release profile of viable Lactobacillus rhamnosus cells from coated microparticles of all formulation batches in simulated intestinal fluid TS, following zero-order kinetics.
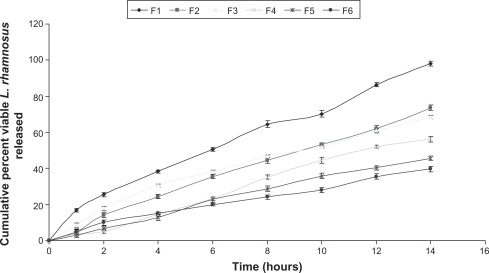
Table 2 Values of the dissimilarity factor (f1), the similarity factor (f2) and the two indices of Rescigno (ξ1 and ξ2)