Figures & data
Figure 1 Schematic illustration of MSNs-GOx/PLL/HA nanoparticles for synergistic tumor-targeted starvation and chemistry therapy. (A) The preparation processes of MSNs-GOx/PLL/HA nanoparticles. (B) The drug delivery of nanoparticles including steps of intravenous injection and EPR effect in blood circulation. (C) The cellular process containing the CD44-mediated cellular internalization, degradation of HA by HAase together with the exposure of PLL at HAase-rich tumor milieu, endosomal or lysosomal escape, cytoplasmic release of GOx and PTX and the intracellular reaction of GOx with glucose.
Abbreviations: MSNs, mesoporous silica nanoparticles; GOx, glucose oxidase; PLL, poly (L-lysine); HA, hyaluronic acid; EPR, enhanced permeation and retention; HAase; hyaluronidase; PTX, paclitaxel.
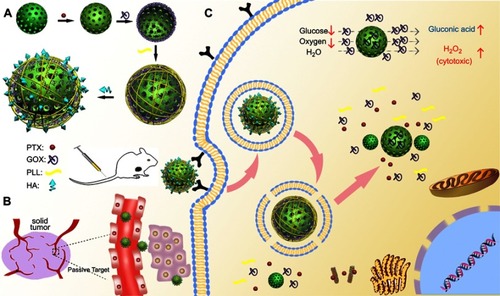
Figure 2 (A) FTIR spectra of MSNs and MSNs-CHO. (B) SAXRD pattern of MSNs and MSNs-CHO. (C) Nitrogen adsorption-desorption isotherms and pore diameter distribution of MSNs and MSNs-CHO. (D) TGA curves of MSNs, MSNs-CHO, MSNs-GOx, MSNs-GOx/PLL and MSNs-GOx/PLL/HA. TEM of (E) MSNs (F), MSNs-CHO (G), MSNs-GOx (H), MSNs-GOx/PLL (I) and MSNs-GOx/PLL/HA.
Abbreviations: MSNs, mesoporous silica nanoparticles; MSNs-CHO, benzaldehyde-functionalized mesoporous silica nanoparticles; GOx, glucose oxidase; PLL, poly (L-lysine); HA, hyaluronic acid; FTIR, Fourier transform infrared; SAXRD, small-angle X-ray diffraction; TGA, thermogravimetric analysis; TEM, transmission electron microscopy.
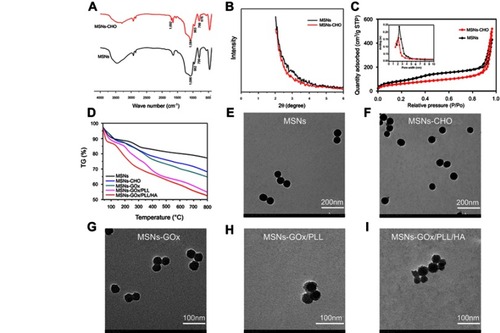
Figure 3 (A) The generated H2O2 concentration and pH value (B) arising from the reaction between free GOx and MSNs-GOx/PLL/HA in glucose medium. In vitro PTX release profiles from MSNs (C) and MSNs-GOx/PLL/HA (D) at different pH values via a stepwise acidification method. (E) Cellular uptake of C6-labeled different nanoparticles. Results are expressed as mean fluorescence values determined by flow cytometry after 1, 2, 4, 8, 12 and 24 hour of incubation. Significant difference from MSNs-C6: ***P<0.001. (F) Real time confocal microscopy images of HepG2 after incubation with C6 labeled MSNs-GOx/PLL/HA.
Abbreviations: GOx, glucose oxidase; MSNs, mesoporous silica nanoparticles; MSNs-CHO, benzaldehyde-functionalized mesoporous silica nanoparticles; PLL, poly (L-lysine); HA, hyaluronic acid; C6, coumarin.
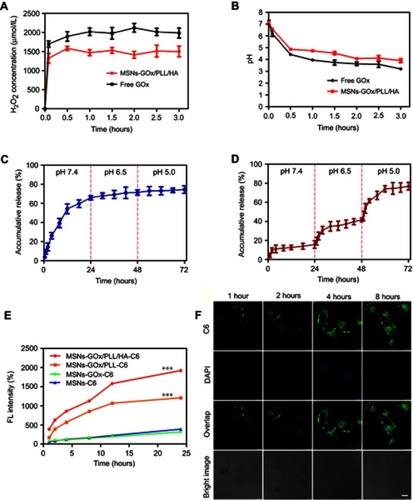
Figure 4 (A) Viability of HepG2 cells treated with different inhibitors. (B) Effects of inhibitors on endocytosis in HepG2 cells. Significant difference from control: **P<0.01, ***P<0.001. (C) Confocal microscope images of HepG2 cells after pre-incubated with different inhibitors. Scale bar: 10 μm. (D) Confocal microscope images of HepG2 cells for intracellular delivery of C6-labeled MSNs, MSNs-GOx, MSNs-GOx/PLL and MSNs-GOx/PLL/HA for different times. The late endosomes and lysosomes were stained by Lyso-Tracker red. 1: overlay of 1, 2 and 3; 2: green fluorescent of C6-labeled nanoparticles; 3: red fluorescent of endo/lysosomes; 4: bright field of cells; 1 hour: incubation with nanoparticles for 1 hour, followed by imaged by CLSM; 1 +2 hours: incubation with nanoparticles for 1 hour, followed by washing and further incubation for 2 hours; 1 +4 hours: incubation with nanoparticles for 1 hour, followed by washing and further incubation for 4 hours; Scale bar: 10 μm.
Abbreviations: GOx, glucose oxidase; MSNs, mesoporous silica nanoparticles; MSNs-CHO, benzaldehyde-functionalized mesoporous silica nanoparticles; PLL, poly (L-lysine); HA, hyaluronic acid; C6, coumarin; CLSM, confocal laser scanning microscopy.
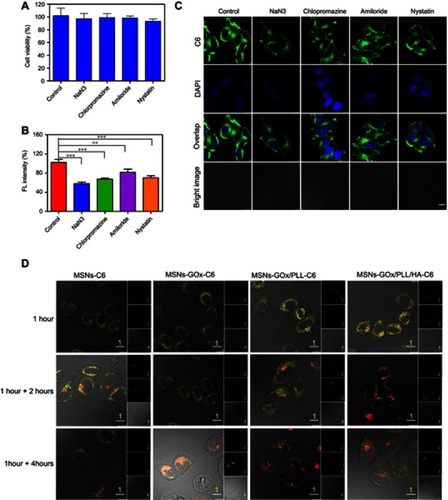
Figure 5 (A) The CD44 expression levels of HepG2 and MCF-7 cells were determined by flow cytometry. (B) The CD44-specific uptake in HepG2 and MCF-7 cells and (C) Z-line fluorescence intensity of C6 were determined by confocal laser scanning microscopy (Scale bar: 10 μm). The distances are indicated by the green lines in (B). (D) Relative fluorescence intensity based on (C); I: HepG2 (MSNs-GOx/PLL/HA), II: HepG2 (blocked), III: HepG2 (HAase), IV: MCF-7 (MSNs-GOx/PLL/HA), V: MCF-7 (blocked), VI: MCF-7 (HAase).
Abbreviations: MSNs, mesoporous silica nanoparticles; GOx, glucose oxidase; PLL, poly (L-lysine); HA, hyaluronic acid; HAase, hyaluronidase; C6, coumarin.
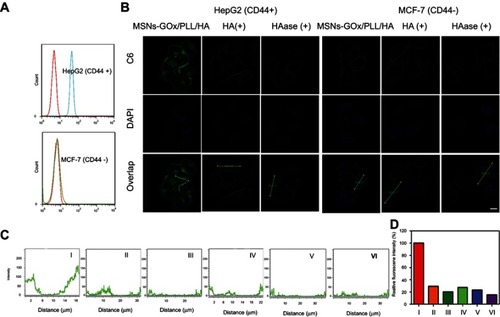
Figure 6 (A) Flow cytometry analysis of intracellular H2O2 generation (using the BES-H2O2-Ac probe) in HepG2 cells after being treated with different preparations. (B) The analysis of intracellular H2O2 generation after incubation with MSNs-GOx/PLL/HA in different concentrations (50, 100, 200, 400, 800 μg/mL) of glucose-containing DMEM media. (C) The quantitative determination of H2O2 level in HepG2 cells after MSNs-GOx/PLL/HA treatment in glucose-free DMEM media. (D) The quantitative determination of H2O2 level in HepG2 cells after incubation with MSNs-GOx/PLL/HA in different concentrations (50, 100, 200, 400, 800 μg/mL) of glucose-containing DMEM media.
Abbreviations: MSNs, mesoporous silica nanoparticles; GOx, glucose oxidase; PLL, poly (L-lysine); HA, hyaluronic acid.
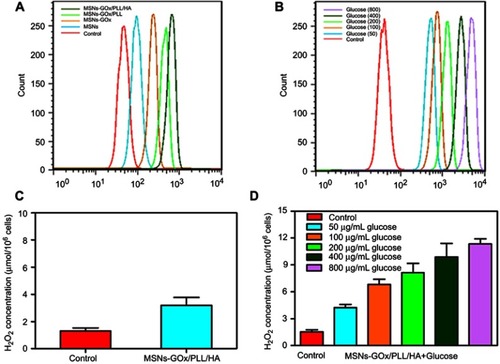
Figure 7 Viabilities of HepG2 cells after 24 hours of incubation with different concentrations of glucose (A) and H2O2 (B). (C) The cell viability after different treatments in the absence and presence of 100 mg/mL glucose. (D) The cell viability after 24 hours of incubation with MSNs-GOx/PLL/HA (20 or 40 μg/mL) in different concentrations (0, 50, 100, 200 μg/mL) of glucose-containing DMEM media. Significant difference from control: *P<0.05, **P<0.01, ***P<0.001. (E) Fluorescent images of live and dead HepG2 cells after different treatments in glucose-free DMEM media and 100 μg/mL glucose-containing DMEM media and stained by calcein AM and PI, respectively.
Abbreviations: MSNs, mesoporous silica nanoparticles; GOx, glucose oxidase; PLL, poly (L-lysine); HA, hyaluronic acid; AM, acetoxymethyl; PI, propidium iodide.
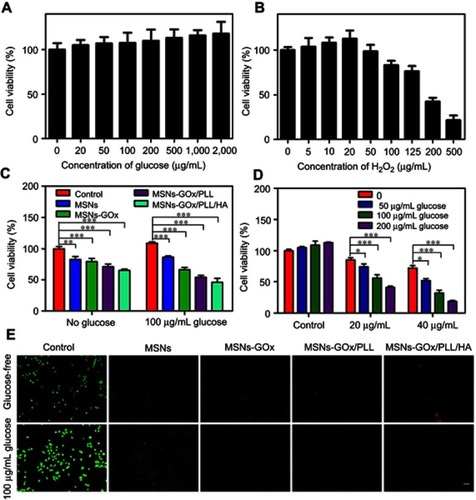
Figure 8 (A) The morphological changes of HepG2 cells detected with dual staining of Hoechst 33,342/PI and captured by fluorescence microscope (magnification 200x). Arrows indicate (1) viable cells with normal nuclei; (2) live cells with apoptotic nuclei; (3) dead cells with normal nuclei; and (4) dead cells with apoptotic nuclei. (B) Apoptosis rate of HepG2 cells was determined by Annexin V-FITC/PI staining. (C) Apoptosis rate of HepG2 cells was analyzed by Annexin V-FITC/PI staining after treatment with MSNs-GOx/PLL/HA in in different concentrations (50, 100, 200, 400, 800 μg/mL) of glucose. (D) Change in mitochondrial membrane potential ΔΨm of HepG2 cells treated with various preparations for 8 hours analyzed by flow cytometry. Significant difference from control: *P<0.05, **P<0.01, ***P<0.001. (E) Effects of treatment with different preparations on the cell cycle of HepG2 cells. (F) The percent of cell cycle distribution after treatment with various formulations for 24 hours. (G) Plasma concentration-time curves of taxol and PTX-loaded nanoparticles in rats after intravenous administration of 2.5 mg/kg PTX (mean ±SD, N=6).
Abbreviations: PI, propidium iodide; FITC, fluorescein isothiocyanate; MSNs, mesoporous silica nanoparticles; GOx, glucose oxidase; PLL, poly (L-lysine); HA, hyaluronic acid.
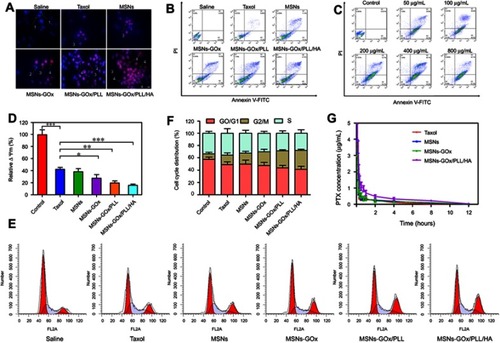
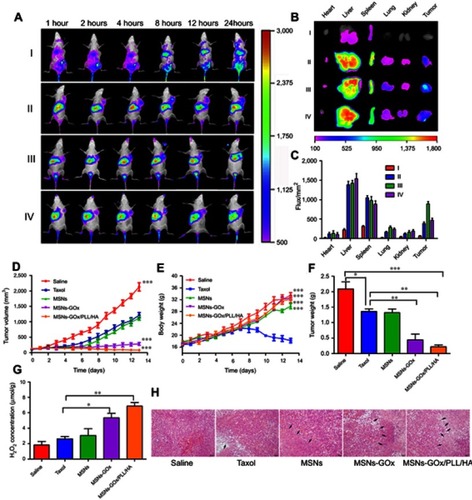
Figure 9 (A) In vivo fluorescence imaging of Heps tumor-bearing mice after intravenous injection with free DiR (I), DiR-loaded MSNs (II), MSNs-GOx/PLL/HA (III) and MSNs-GOx/PLL/HA with pre-injection of the free HA (10 mg/kg) for 1 hour (IV). (B) Fluorescence images of major organs and tumor ex vivo 24 hours post-injection, including heart, liver, spleen, lung, kidney, and tumor. (C) Fluorescence intensity of the DiR signals in different tissues harvested from the mice at 24 hours post-injection. (D) Tumor growth curves. (E) Body weight changes. (F) Average tumor weight after the study. (G) The change of H2O2 concentrations in Heps tumors at 6 hours after injection with different preparation. Data were shown as mean ±SD, (N=6). Significant difference from control: *P<0.05, **P<0.01, ***P<0.001. (H) Representative images of the H&E-stained tumor sections after treatment with different nanoparticles. Black arrows indicate examples of positive tumor suppression with H&E staining. The images were taken at 200× magnification.
Abbreviations: MSNs, mesoporous silica nanoparticles; GOx, glucose oxidase; PLL, poly (L-lysine); HA, hyaluronic acid.