
Figures & data
Figure 1 Synthesis and 1H-NMR spectra of CS-ES2-AF. (A) Synthetic route of CS-ES2-AF. 1H-NMR spectra of (B) CS, (C) CS-TBA, and (D) CS-ES2-AF.
Abbreviations: CS, chondroitin sulfate; 1H-NMR, 1H-nuclear magnetic resonance spectroscopy.
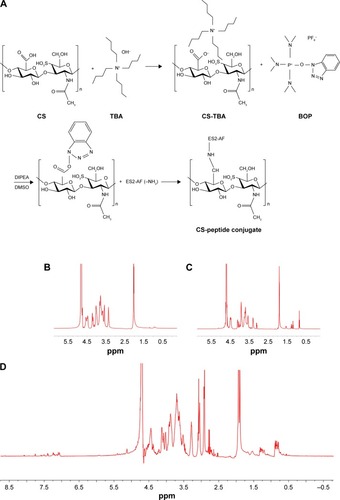
Figure 2 Characterization of CS-ES2-AF nanoparticles. (A) TEM image of CS-ES2-AF and ES2-AF nanoparticles. (B) Size distribution of CS-ES2-AF and ES2-AF nanoparticles.
Abbreviations: CS, chondroitin sulfate; TEM, transmission electron microscopy.
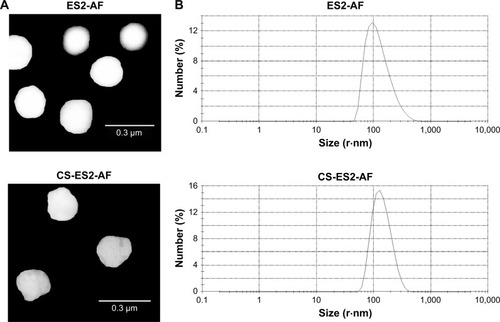
Figure 3 (A) Inhibitory effects of peptide ES2-AF and conjugate CS-ES2-AF on the proliferation of EA.hy926 endothelial cells after incubation for 48 hours. (B) Comparison of the effects of ES2-AF, the mixture of CS&ES2-AF, and CS-ES2-AF conjugation based on in vitro ELISA assay. Data represent mean ± SD (n=5). **P<0.01 is considered significantly different compared with the ES2-AF group.
Abbreviation: CS, chondroitin sulfate.
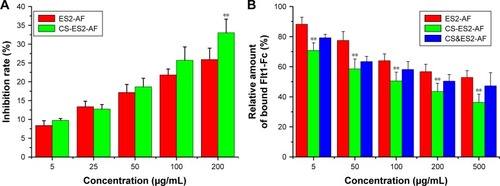
Figure 4 Effects of different samples on the inhibition of cell migration, tube formation, and CAM: (i) represents the ES2-AF sample; (ii) represents the CS-ES2-AF sample; and (iii) represents the CS&ES2-AF sample. (A) Cell migration assay. (B) Tube formation assay. (C) CAM assay. Comparison of different samples for (D) cell migration and (E) tube formation. (F) Comparison of the inhibition of ES2-AF and its derivatives and the mixture on CAM angiogenesis. Data represent mean ± SD (n=5). #P<0.05 is considered significantly different compared with the control group. ##P<0.01 is considered significantly different compared with the control group. *P<0.05 is considered significantly different compared with the ES2-AF group. **P<0.01 is considered significantly different compared with the ES2-AF group.
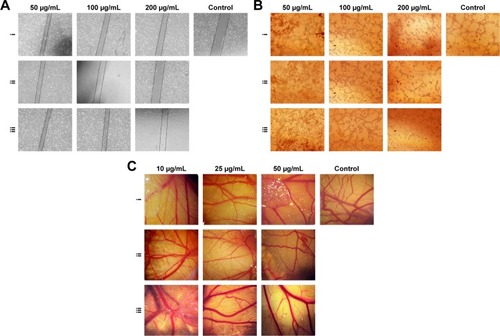
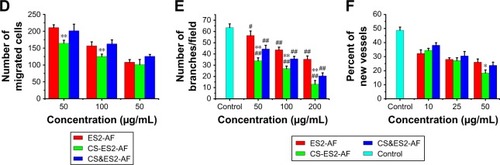
Figure 5 Binding ability of CS-ES2-AF to the CD44 receptor in vitro. (A) pH scouting of CD44 in acetate buffer solution. (B) SPR sensorgram of different concentrations of CS-ES2-AF over a chip with immobilized CD44. (C) SPR sensorgram of different concentrations of ES2-AF over a chip with immobilized CD44.
Abbreviations: CS, chondroitin sulfate; SPR, surface plasmon resonance.
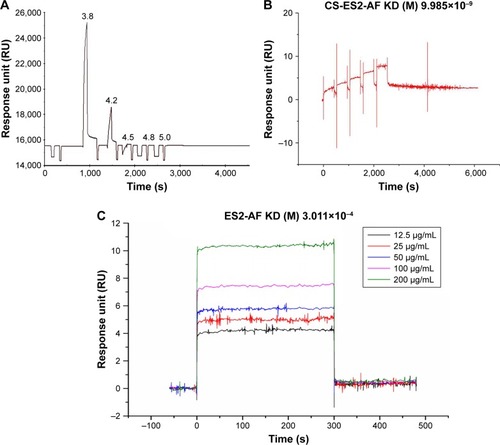
Figure 6 In vivo tumor-targeting ability of CS-ES2-AF in nude mice bearing B16 tumor xenografts, monitored by the Optix system. Tumor is indicated using red circle.
Abbreviation: CS, chondroitin sulfate.
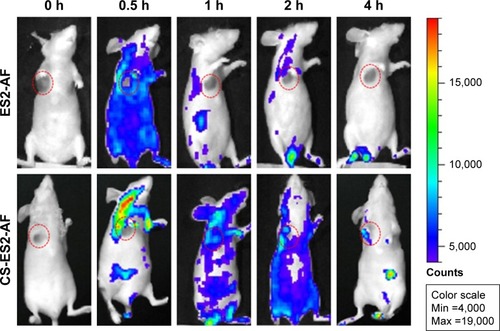
Figure 7 Pharmacokinetic time curves of ES2-AF and CS-ES2-AF in plasma after single intravenous administration. The results are shown as means ± SD (n=5).
Abbreviation: CS, chondroitin sulfate.
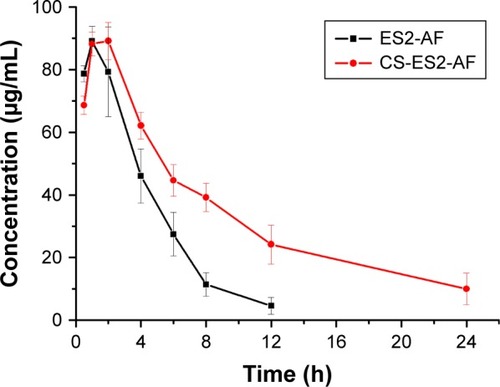
Table 1 Pharmacokinetic parameters of plasma concentration of ES2-AF and CS-ES2-AF in mice