Figures & data
Table 1 BET test results on DIBc NMOF
Table 2 Groups of rats and their regimen
Table 3 Composition of normal and high-fat diet
Figure 1 The timeline of study.
Abbreviation: STZ, streptozotocin.
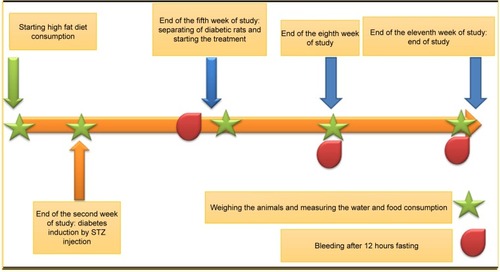
Figure 2 HRTEM image of DIBc NMOF, which indicates that the size of the NMOF is about 25–30 nm.
Abbreviations: HRTEM, high-resolution transmission electron microscopy; NMOF, nano metal–organic framework.
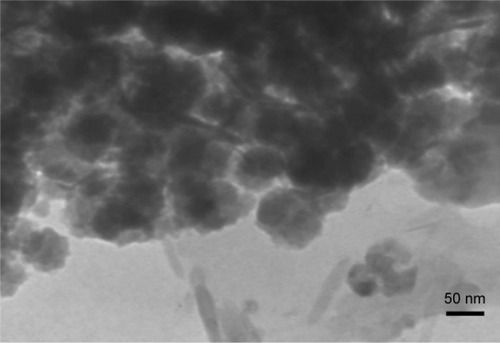
Table 4 DIBc effects on food and water intake and weight gain
Table 5 DIBc effects on plasma glucose, insulin, TG, cholesterol, LDL, and HDL level
Figure 3 The percentage of HOMA-IR index and plasma glucose and insulin changes in each group at week 11 compared with the fifth week of the study. Each column shows mean ± SEM for eight rats.
Abbreviation: HOMA-IR, homeostasis model assessment of insulin resistance.
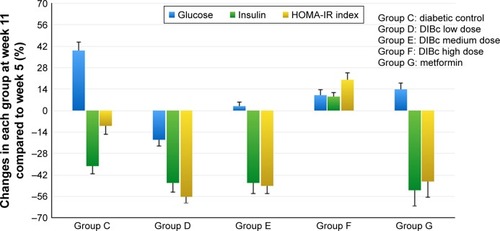
Figure 4 The plasma level of TNF-α (A) and MDA (B). Each column shows mean ± SEM for eight rats.
Notes: Significant differences vs the normal control group have been specified by square (#) meaning P-value <0.05. Significant differences vs the diabetic group have been specified by asterisk (*) meaning P-value <0.05.
Abbreviation: MDA, malondialdehyde.
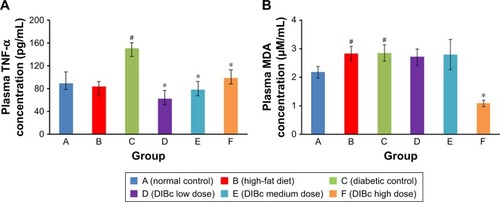
Figure 5 Hepatic (A) and plasma (B) iron level. Each column shows mean ± SEM for eight rats.
Note: Significant differences vs the normal control group have been specified by square (#) meaning P-value <0.05.
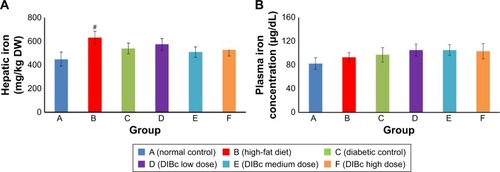
Figure 6 Hemoglobin concentration (A), RBC count (B), hematocrit (C) and mean cell volume (D). Each column shows mean ± SEM for eight rats.
Notes: Significant differences vs the normal control group have been specified by square (#) meaning P-value <0.05. Significant differences vs the diabetic group have been specified by asterisk (*) meaning P-value <0.05.
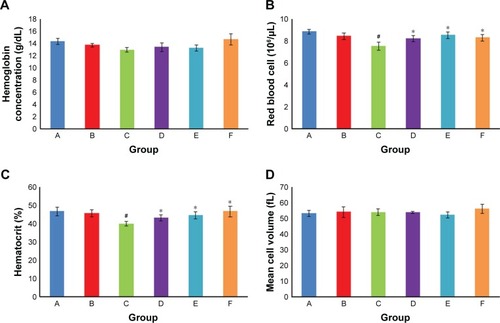
Figure 7 The area of islets (A) and their numbers (B).
Notes: Each column shows mean ± SEM for eight rats. Significant differences vs the normal control group have been specified by square (#) meaning P-value <0.05. Significant differences vs the diabetic group have been specified by asterisk (*) meaning P-value <0.
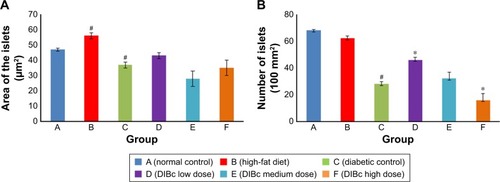
Figure 8 H&E images from pancreatic islet of rats in different groups: normal control group (A), high-fat diet group (B), diabetic control group (C), DIBc low-dose group (D), DIBc medium-dose group (E), and DIBc high-dose group (F).
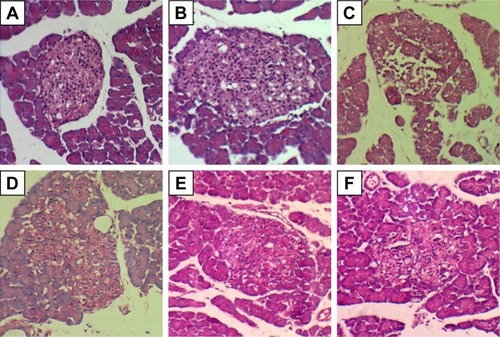
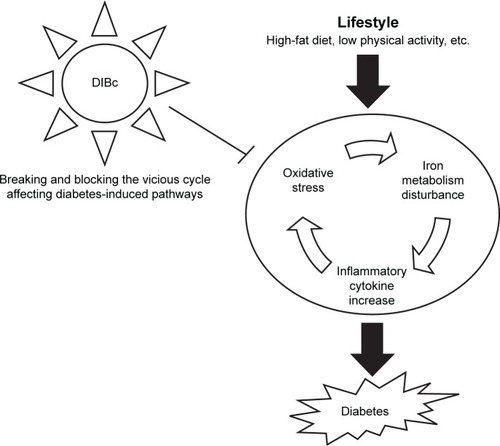
Figure 9 The schema of the proposed mechanism for the inhibitory effects of DIBc on diabetes.