Figures & data
Figure 1 Comparison of FTIR spectra of EPS before and after metal reactions. Black line corresponds to EPS as used for the reactions. Blue line corresponds to EPS with the synthesized Zn nanoparticles. Green line corresponds to EPS with the synthesized Ni nanoparticles.
Abbreviations: FTIR, Fourier transform-infrared spectroscopy; EPS, exopolysaccharides.
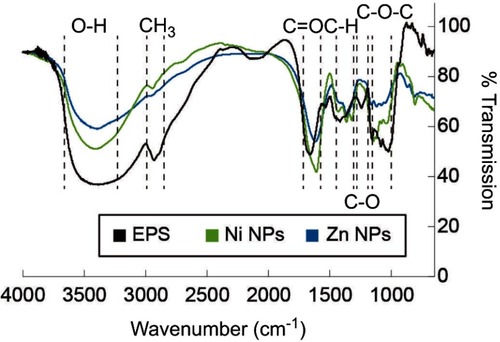
Figure 2 UV-Vis spectra of the EPS and the synthesized nanoparticles. Black line represents the EPS as used before reactions, light blue line represents the Zn nanoparticles synthesized, dark blue line represents the Zn(II) ions at concentration used in the synthesis reaction, the light green line represents the Ni nanoparticles synthesized, dark green line represents the Ni(II) ions at concentration used in the synthesis reaction and the gray line represents the sample media.
Abbreviation: EPS, exopolysaccharides.
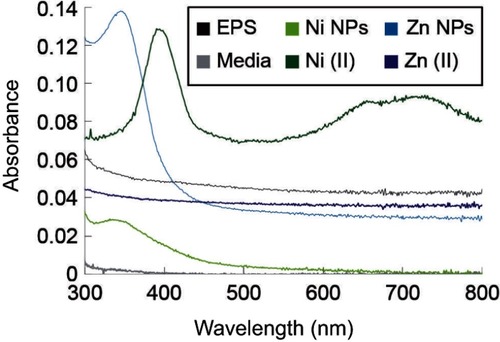
Figure 3 TEM analysis of the synthesized Zn nanoparticles. (A) TEM micrography of Zn nanoparticles in the EPS matrix. (B) SAED pattern of the synthesized Zn nanoparticles. (C) Elemental composition of the ESP capped Zn nanoparticles.
Abbreviations: EPS, exopolysaccharides; TEM, transmission electron microscopy; SAED, selected area electron diffraction.
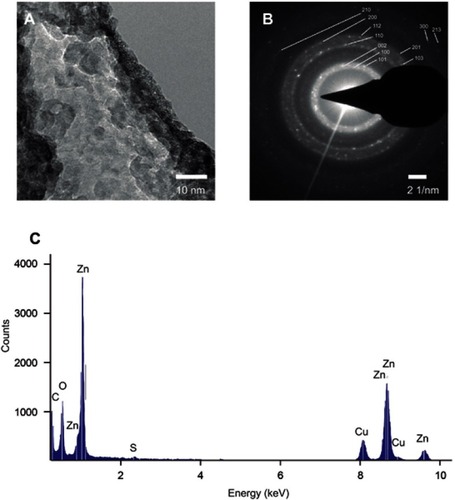
Figure 4 TEM analysis of the synthesized Ni nanoparticles. (A) TEM micrography of Ni nanoparticles in the EPS matrix. (B) SAED pattern of the synthesized Ni nanoparticles. (C) Elemental composition of the ESP capped Ni nanoparticles.
Abbreviations: EPS, exopolysaccharides; TEM, transmission electron microscopy; SAED, selected area electron diffraction.

Figure 5 Antimicrobial activity of EPS-capped metal nanoparticles against antibiotic-resistant strains. Growth percentage of bacteria treated with different concentration of metal nanoparticles. (A) Effect of the EPS and EPS-capped nanoparticles against SaR. (B) Effect of EPS and EPS-capped nanoparticles against PaR. a shows significant difference from untreated control. b shows significant difference from EPS at the same concentration. c shows significant difference from NiNPs at the same concentration. d shows significant difference from ZnNPs at the same concentration. Error bars show standard deviation. Every experiment was carried out with replicates of three.
Abbreviation: EPS, exopolysaccharides.
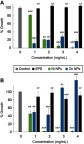
Figure 6 Antibiofilm activity of EPS-capped metal nanoparticles against antibiotic-resistant strains. Biofilm formation percentage of bacteria treated with different concentration of metal nanoparticles. (A) Effect of the EPS and EPS-capped nanoparticles against SaR. (B) Effect of EPS and EPS-capped nanoparticles against PaR. a shows significant difference from untreated control. b shows significant difference from EPS at the same concentration. c shows significant difference from NiNPs at the same concentration. d shows significant difference from ZnNPs at the same concentration. Error bars show standard deviation. Every experiment was carried out with replicates of three.
Abbreviation: EPS, exopolysaccharides.
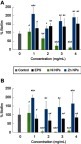
Figure 7 The effect of EPS-capped NiO, ZnO composites on the membrane leakage of reducing sugars to the culture media. Percentage increment of leaked reducing sugars to the culture media of SaR and PaR caused by the exposure of both synthesized composites and EPS at 3 mg/mL, and comparing to an untreated control. Error bars show standard deviation. * indicates significant difference (p<0.05) compared to the untreated control. Every experiment was carried out with replicates of three.
Abbreviation: EPS, exopolysaccharides.
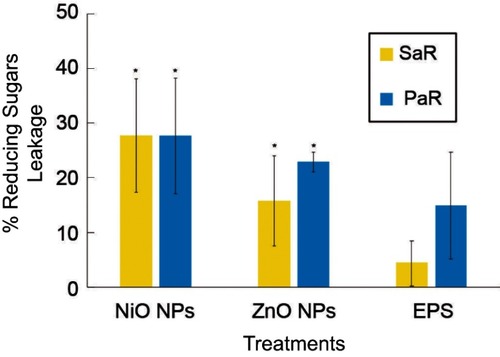
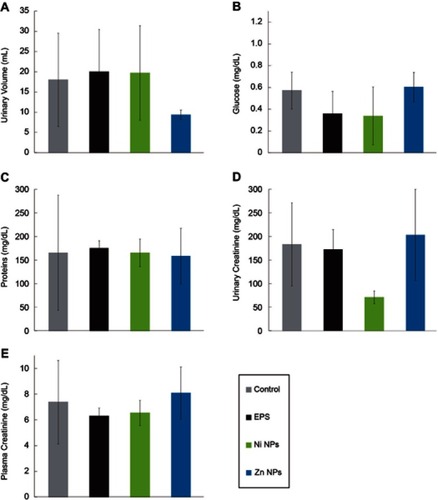
Figure 8 Parameters of renal function of Wistar rats treated with EPS-capped Ni and Zn nanoparticles. Test was performed treating rats with 6 mg/mL of buffer (control), EPS, NiNPs and ZnNPs. (A) urinary volume, (B) glucose, (C) total proteins, (D) urinary creatinine and (E) plasma creatinine. Error bars show standard deviation. Every experiment was carried out with replicates of three.
Abbreviation: EPS, exopolysaccharides.