Figures & data
Figure 1 Cytotoxicity assay of free CDDP and free OA against HepG2 cells. (A) Combination indices at non-fixed ratios (72 h). (B) Corresponding CI vs Fa plot at various non-fixed ratios generated through Compusyn Software. Data presented as mean±SD, n=5.
Abbreviations: CDDP, cisplatin; OA, oleanolic acid; CI, combination index; Fa, fraction affected.
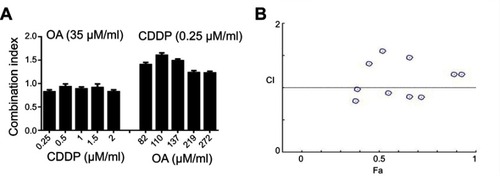
Table 1 Experimental design followed for the formulation of CDDP/OA-LCC NPs
Figure 2 (A) Schematic illustration of the formulation of lipid-coated cisplatin/oleanolic acid co-loaded calcium carbonate nanoparticles (CDDP/OA-LCC NPs); (B) TEM images of CDDP/OA-LCC NPs, scale bar: 500 nm; (C) In vitro cumulative release profiles of CDDP and OA from the CDDP/OA-LCC NPs in PBS (72 h) at pH 7.4; (D) In vitro cumulative release profiles of CDDP and OA from the CDDP/OA-LCC NPs in PBS (72 h) at pH 5.5.
Abbreviations: CDDP, cisplatin; DOPA, dioleoyl-in-glycerol-3-phosphate; OA, oleanolic acid; PEG-DSPE 2000, mono-methoxy polyethylene glycol 2000-distearoyl phosphatidylethanolamine; LCC, lipid coated calcium carbonate; NP, nanoparticles; HSPC, dehydrogenated soya phosphatidylcholine; PBS, phosphate buffer saline.
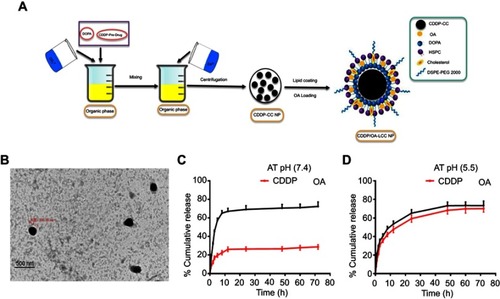
Figure 3 Cytotoxicity assay of the nanoparticles against HepG2 cells (72 h). (A) CDDP-LCC NPs MTT assay; (B) OA-LCC NPs MTT assay; (C) CDDP/OA-LCC NPs MTT assay with fixed ratios. Data presented as mean±SD, n=5.
Abbreviation: CDDP/OA-LCC NPs, CDDP and OA-lipid coated calcium carbonate nanoparticles.
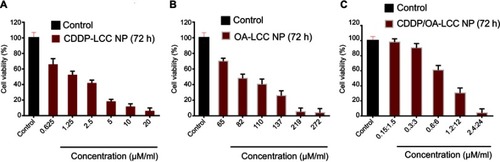
Figure 4 Fluorescence microscopic images of the HepG2 cells treated with C-6 labeled CDDP-LCC NPs. Cells nuclei stained blue by DAPI, green fluorescence distributed in the cytoplasm from C-6 labeled nanoparticles, and finally merging of two images.
Abbreviations: CDDP-LCC NPs, CDDP lipid coated calcium carbonate nanoparticles; C-6, coumarin-6.
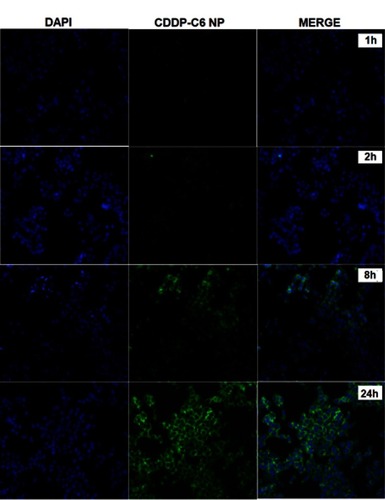
Figure 5 CDDP/OA-LCC NPs induce apoptosis in HepG2 cells. (A) Annexin V-FITC/PI double staining apoptosis assay results; (B) cell cycle analysis of HepG2 cancer cells.
Abbreviations: CDDP, cisplatin; OA, oleanolic acid; LCC, lipid coated calcium carbonate; NP, nanoparticles, UR, upper right; UL, upper left; LL, lower left; LR, lower right; Q2, quadrant.
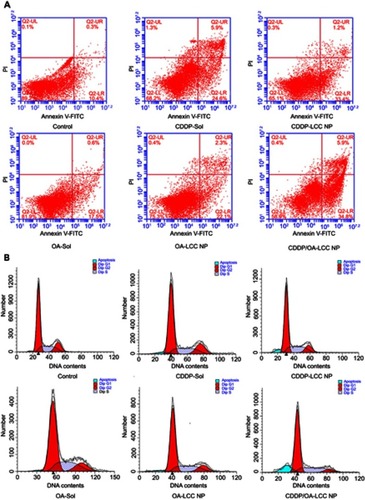
Figure 6 OA alleviates cisplatin-induced hepatotoxicity. Representative sections from mice liver tissue stained by H & E (200× magnification). (A) Control (NS): normal histological structure of the hepatic lobule. (B) Corn oil group: normal hepatic histology with few hydrophobic degenerations of hepatocytes and normal central vein. (C) OA sol+CDDP sol group: mild hydrophobic degeneration of hepatocytes and mild congested central vein. (D) OA-LCC NP and CDDP-LCC NP group: moderate hepatocytes vacuolization. (E, F). CDDP-sol and CDDP-LCC NPs injection group’s, respectively, hepatic necrosis, severe toxicity, congestion and dilatation of the central vein. (G). CDDP/OA-LCC NPs injection group: less toxicity, less vacuolization; (H) oleanolic acid pre-treatment improved liver function and inhibited cisplatin-induced aberrations in ALT, AST levels.
Abbreviations: ALS, Alanine Aminotransferase; AST, aspartate aminotransferase; CDDP, cisplatin; OA, oleanolic acid; LCC, lipid coated calcium carbonate; NP, nanoparticles; CV, central vein.
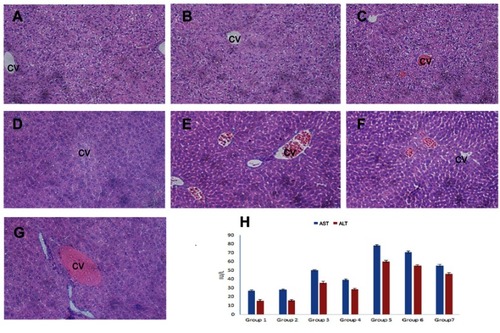
Figure 7 Western blot analysis of protein levels (p53, Bax, Bad, Cyto-C, caspase-3, NF-κB, Bcl-2, and XIAP) after treating HepG2 cells with CDDP-Sol, CDDP-LCC NP, OA-Sol, OA-LCC NP, CDDP/OA-LCC NP in vitro. β-actin was used as a loading control. Quantification of protein level using Image J. Data presented as mean±SD (n=3).
Abbreviations: CDDP, cisplatin; OA, oleanolic acid; LCC, lipid coated calcium carbonate; NP, nanoparticles.
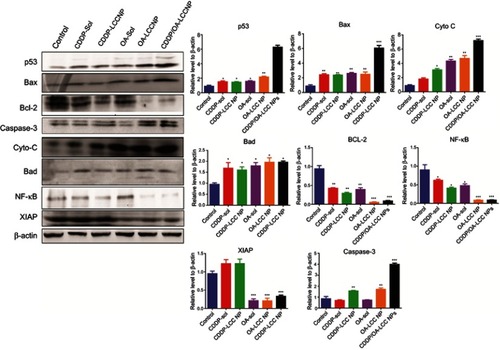
Figure S1 Cytotoxicity assay of free CDDP and free OA against HepG2 cells. (A) MTT assay results of free CDDP solution against HepG2 cells for 24, 48, and 72 h; (B) MTT assay results of free OA solution against HepG2 cells for 24, 48, and 72 h. Data presented as mean±SD (n=5).
Abbreviations: CDDP, cisplatin; OA, oleanolic acid.
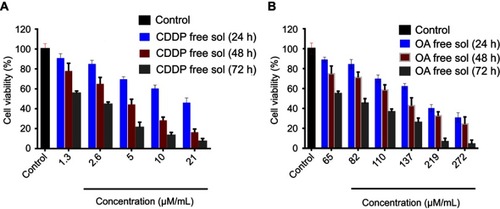
Figure S2 CDDP/OA-LCC NPs induces apoptosis in HepG2 cells. Hoechst 33,258 nuclear staining cell apoptosis images. (A) Control; (B) CDDP-Sol; (C) CDDP-LCC NPs; (D) OA-Sol; (E) OA-LCC NPs; (F) CDDP/OA-LCC NPs.
Abbreviations: CDDP, cisplatin; OA, oleanolic acid; LCC, lipid coated calcium carbonate; NP, nanoparticles.
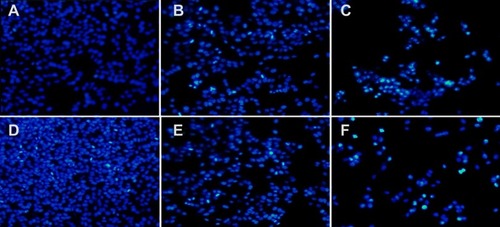
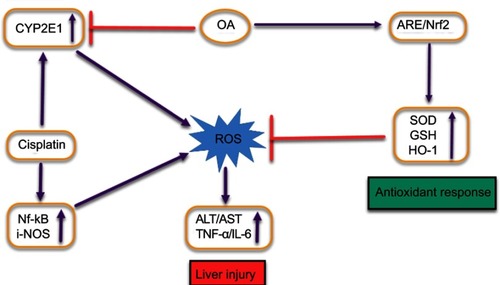
Figure S3 Graphical representation depicting the proposed protective mechanisms of oleanolic acid (OA) co-administration on liver injury induced by cisplatin