Figures & data
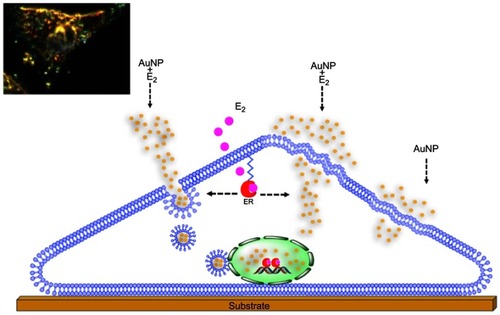
Figure 1 High resolution atomic force microscopy images revealed details of the MCF-7 membrane surface. Images: Show the surface (top-view presentation) which correspond to (A) 50×50µm, (B) 20×20 µm, (C) 10×10 µm, (D) 5×5 µm, (E) 1×1 µm, (F) 0.6×0.6 µm, (G) 0.5×0.5 µm. Three-dimensional images for (H) 0.5×0.5 µm and (I) 0.25×0.25 µm were achieved. Red arrowheads show the zone where the next scan magnification was taking place. Z values: (A) =0–1532.57 nm; (B) =0–616.2 nm; (C) =0–519.13 nm; (D) =0–366.5 nm; (E) =0–78 nm; (F) =0–50 nm and (G) =0–30 nm.
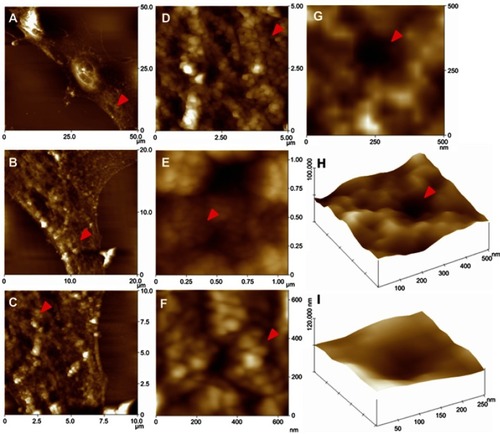
Figure 2 Surface roughness of the MCF-7 cells at different times of AuNP exposure, in the absence or presence of E2. The RMS[Rq] values were evaluated after 6, 12, 18 and 24 h. Significative difference was observed at 12 hrs of incubation with E2+AuNP treatment and the rest of times (6, 18 and 24 hrs) P≤0.05 vs 6, 18 and 24 h.
Abbreviations: AuNP, gold nanoparticle; E2, 17β-estradiol; RMS[Rq], roughness values; Vh, vehicle.
![Figure 2 Surface roughness of the MCF-7 cells at different times of AuNP exposure, in the absence or presence of E2. The RMS[Rq] values were evaluated after 6, 12, 18 and 24 h. Significative difference was observed at 12 hrs of incubation with E2+AuNP treatment and the rest of times (6, 18 and 24 hrs) P≤0.05 vs 6, 18 and 24 h.Abbreviations: AuNP, gold nanoparticle; E2, 17β-estradiol; RMS[Rq], roughness values; Vh, vehicle.](/cms/asset/c6a15bee-662f-4571-9fcc-dab74d3ccd22/dijn_a_12190794_f0002_c.jpg)
Figure 3 Effects of the ER-antagonist (ICI) on the E2-induced increase of the MCF-7 cell membrane roughness, in the absence and presence of AuNP. (A) Graphic shows significant differences in the roughness values at 12 hrs of incubation with different treatments compared with the control group (ethanol-treated cells). Results were obtained sequentially in three different areas of the cell and on three different cells, in triplicate. Different letters (a-d) show statistical differences between groups in the RMS[Rq] value; *P≤0.05 vs control. (B) Representative high-resolution AFM images show changes in the surface roughness of the MCF-7 cell membrane under different treatments. The image size: 5×5 µm, with Z=0 a 250 nm. (0.25 µm).
Abbreviations: AFM, atomic force microscopy; AuNP, gold nanoparticle; E2, 17β-estradiol; ICI, 7α,17β-[9-[(4,4,5,5,5-Pentafluoropentyl)sulfinyl]nonyl]estra-1,3,5(10)-triene-3,17-diol; RMS[Rq], roughness values; Vh, vehicle.
![Figure 3 Effects of the ER-antagonist (ICI) on the E2-induced increase of the MCF-7 cell membrane roughness, in the absence and presence of AuNP. (A) Graphic shows significant differences in the roughness values at 12 hrs of incubation with different treatments compared with the control group (ethanol-treated cells). Results were obtained sequentially in three different areas of the cell and on three different cells, in triplicate. Different letters (a-d) show statistical differences between groups in the RMS[Rq] value; *P≤0.05 vs control. (B) Representative high-resolution AFM images show changes in the surface roughness of the MCF-7 cell membrane under different treatments. The image size: 5×5 µm, with Z=0 a 250 nm. (0.25 µm).Abbreviations: AFM, atomic force microscopy; AuNP, gold nanoparticle; E2, 17β-estradiol; ICI, 7α,17β-[9-[(4,4,5,5,5-Pentafluoropentyl)sulfinyl]nonyl]estra-1,3,5(10)-triene-3,17-diol; RMS[Rq], roughness values; Vh, vehicle.](/cms/asset/b6a26c1c-772e-4e66-8d2a-17a49793fe33/dijn_a_12190794_f0003_c.jpg)
Figure 4 Representative CLSM images of intracellular AuNPs after 12 h of incubation in MCF-7 cells. AuNP uptake is enhanced by E2 and particles are taken closer to the cell nucleus. The fluorescence signal of AuNP (red) was observed around the cell nuclei that were stained with DAPI (cyan). Digitally zoomed images (10× magnification) are shown in right column to better illustrate the localization of AuNP. Scale bars are 20 μm.
Abbreviations: AuNP, gold nanoparticle; CLSM, confocal laser scanning microscopy; DAPI, 4ʹ,6-diamidino-2-phenylindole.
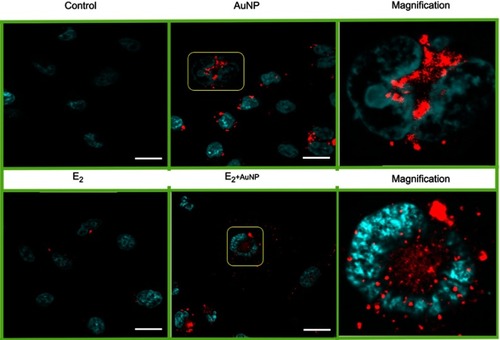
Figure 5 Image shown the effect of E2 on cellular AuNP uptake and vesicle formation; representative observations were acquired in CLSM. (A) From left to right it can be seen MCF-7 cells in the bright field, DAPI-stained nuclei (blue), endosomal-lysosomal system stained with LT (red) and highlighted areas of colocalization (squares), where it is shown that E2 increases lysosomes formation compared with Vh-treated cells. (B) E2 increases AuNP uptake (cyan) by the lysosomes pathway (red), effect that is precluded in the presence of the ER antagonist (ICI). Scale bars are 60 μm.
Abbreviations: AuNP, gold nanoparticle; CLSM, confocal laser scanning microscopy; DAPI, 4',6-diamidino-2-phenylindole; E2, 17β-estradiol; ICI, 7α,17β-[9-[(4,4,5,5,5-Pentafluoropentyl)sulfinyl]nonyl]estra-1,3,5(10)-triene-3,17-diol; LT, LysoTracker; Vh, vehicle.
![Figure 5 Image shown the effect of E2 on cellular AuNP uptake and vesicle formation; representative observations were acquired in CLSM. (A) From left to right it can be seen MCF-7 cells in the bright field, DAPI-stained nuclei (blue), endosomal-lysosomal system stained with LT (red) and highlighted areas of colocalization (squares), where it is shown that E2 increases lysosomes formation compared with Vh-treated cells. (B) E2 increases AuNP uptake (cyan) by the lysosomes pathway (red), effect that is precluded in the presence of the ER antagonist (ICI). Scale bars are 60 μm.Abbreviations: AuNP, gold nanoparticle; CLSM, confocal laser scanning microscopy; DAPI, 4',6-diamidino-2-phenylindole; E2, 17β-estradiol; ICI, 7α,17β-[9-[(4,4,5,5,5-Pentafluoropentyl)sulfinyl]nonyl]estra-1,3,5(10)-triene-3,17-diol; LT, LysoTracker; Vh, vehicle.](/cms/asset/4f60ac42-3570-41cb-80d2-d5494355f63f/dijn_a_12190794_f0005_c.jpg)
Figure 6 Hyperspectral image (A) and spectra (B) inside MCF7 cell nucleus (N) or the cytoplasmic region, outside nucleus (O). Breast cancer cells were incubated with AuNP, in the presence or absence of E2, after 12 hrs. Scattering spectra of the AuNP incubation (black line) is compared with the spectra generated by the co-incubation of E2 and AuNP (red line) inside the nucleus (left) or outside (right). The images were acquired using a 50× objective in reflectance mode. The inset letters (N, O) show the regions where hyperspectral image were taken.
Abbreviations: AuNP, gold nanoparticle; E2, 17β-estradiol.
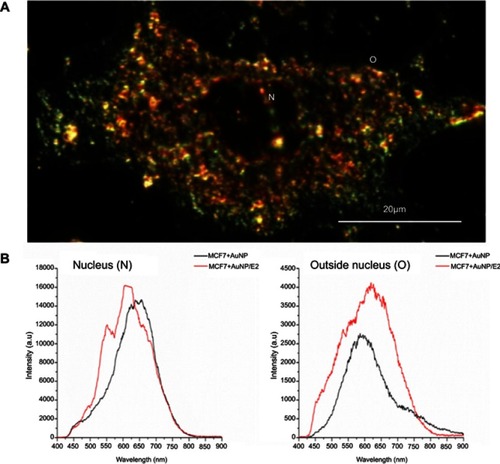
Figure 7 Estradiol (E2) increases the gold nanoparticles (AuNP) uptake into the breast cancer cell. One mechanism of AuNP cellular internalization is mediated by the formation of vesicle (lysosomes) and the transport to regions nearby the nucleus. Other mechanism can be due to the increase on the cell surface roughness and thereby promoting the AuNP diffusion across the plasma membrane.