Figures & data
Figure 1 Characterization of the cuprous oxide nanoparticles (CONPs). (A) The zeta potential spectrum of CONPs; (B) the size distribution spectrum of CONPs; (C) the TEM image.
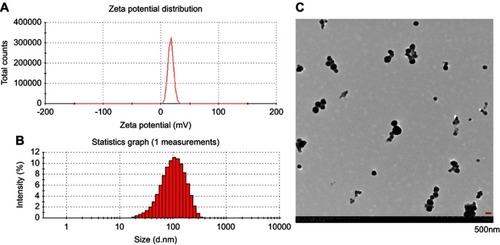
Figure 2 Gross examination images. Cuprous oxide nanoparticles (CONPs)-treated scars improved significantly on gross examination and were softer and less visible compared with their controls group, which gradually became raised, red, and stiff after re-epithelization.
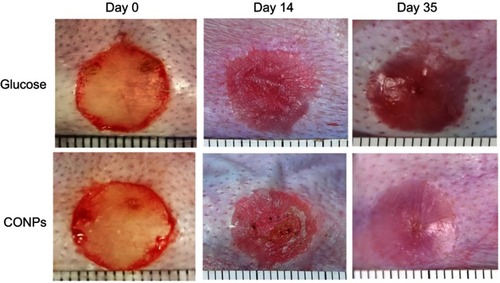
Figure 3 Masson trichrome staining. Masson trichrome staining was used for the evaluation of collagen fiber organization. Collagen fibers were dense and disorderly in the control scars (A, B), and significantly improved in cuprous oxide nanoparticles (CONPs)-treated scars (C, D).
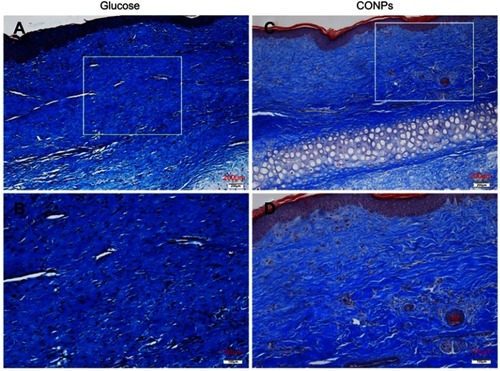
Figure 4 Ultrasonography of the wounds. The results showed a thinner thickness and an evident lower scar elevation index (SEI) in cuprous oxide nanoparticles (CONPs)-treated scars than internal controls. Column shows the quantitative measurements of the SEI of two groups. Student t-test was used to analyze data (***P<0.001).
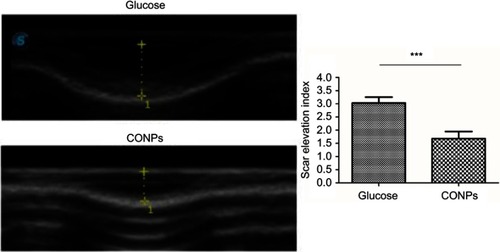
Figure 5 Effects of cuprous oxide nanoparticles (CONPs) on HSFs. The proliferation of HSFs was significantly inhibited after treated with different concentrations of CONPs. Cells treated with CONPs grew slow, floating with a spherical shape, while cells in control group were spindle and grew quick.
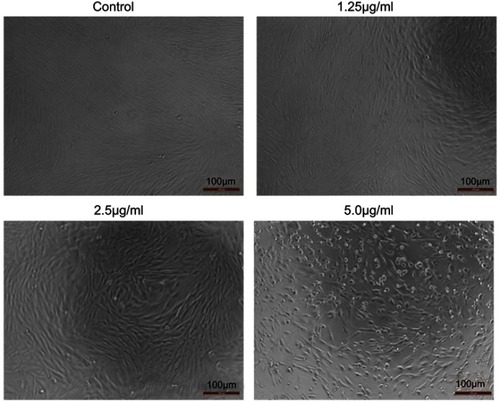
Figure 6 EdU stain of HSFs treated with different concentrations of cuprous oxide nanoparticles (CONPs) for 24h. The percentage of EdU positive cells was reduced gradually with the increasing concentration of CONPs, The proliferation of HSFs was significantly suppressed by CONPs in a dose-dependent manner. The quantitative measurements of the percentage of EdU positive cells were presented in column shows. Values are mean ± SD of three independent experiments. Significant difference is observed and compared with each group (***P<0.001).
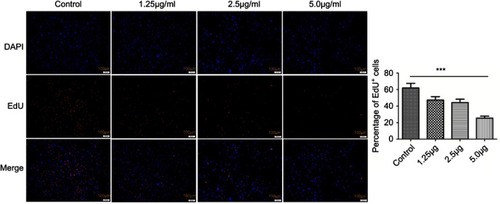
Figure 7 Cell cycle progression assay of HSFs treated with different concentrations of cuprous oxide nanoparticles (CONPs) for 24h. With the increasing concentration of CONPs, the percentage of cells in G2/M phase significantly increased, while the percentage of cells in GO/G1 phase notably decreased, yet the percentage of cells in S phase had no significant change. Column shows the quantitative measurements of the percentage of different cell cycles from three independent experiments. One way ANOVA were used to analyze data (*p<0.05, **p<0.01, ***p<0.001).
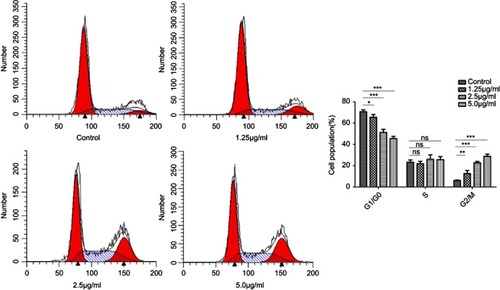
Figure 8 TUNEL assay of apoptosis of HSFs treated with different concentrations of cuprous oxide nanoparticles (CONPs) for 24 h. 2.5 μg/mL and 5.0 µg/mL CONPs caused significant TUNEL positive cells in HSFs.
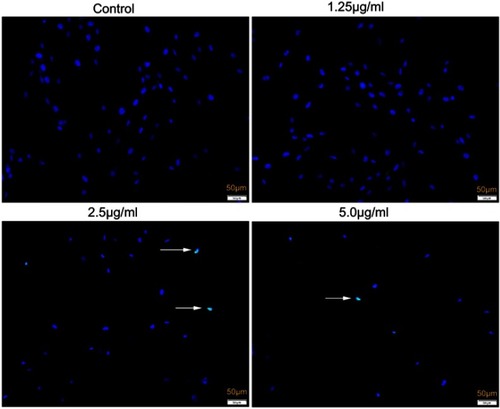
Figure 9 Flow cytometry analysis of HSFs treated with different concentrations of cuprous oxide nanoparticles (CONPs) for 24h, followed by staining with Annexin V-FITC and PI. The apoptosis ratio of HSFs was increased in a dose-dependent manner. Q1-UL, dead cells; Q1-LR, apoptotic cells at the early stage; Q1-LL, live cells; Q1-UR, apoptotic cells at the early stage. The results (mean ± SD) were statistically significant (*p<0.05, **p<0.01), and the assays were performed three times.
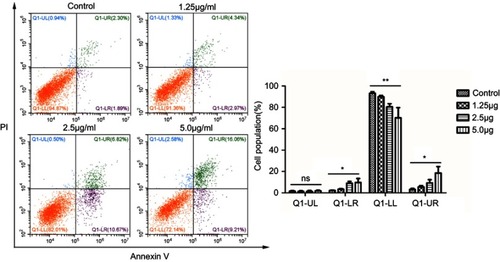
Figure 10 Electron microscopy images showing the ultrastructure of HSFs incubated for 3–4 h in 5 µg/mL cuprous oxide nanoparticles (CONPs). Several CONPs crossed the cell membrane (A) and entered the mitochondria (B), and lysosome (C).
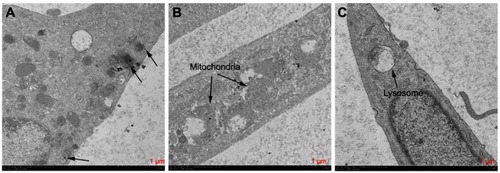
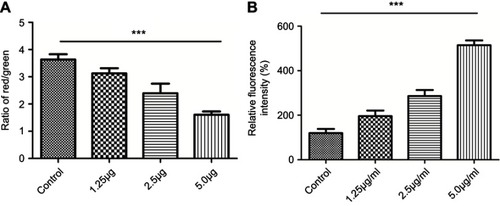
Figure 11 JC-1 (A) and ROS (B). (A) The ratio of the red fluorescent intensity to the green fluorescent intensity gradually decreased with the increasing concentration of cuprous oxide nanoparticles (CONPs); (B) intracellular ROS levels in HSFs significantly increased in a concentration-dependent manner after treated with CONPs. The results were statistically significant (***p<0.001), and the assays were performed three biological times.