Figures & data
Figure 1 (A) Size and (B) polydispersity index of RHA nanoparticles analyzed by dynamic light scattering. Data are shown as mean with SD error bars (n = 3). Significance difference: *** (P < 0.001). (C) Transmission electron microscopy image of RHA nanoparticles.
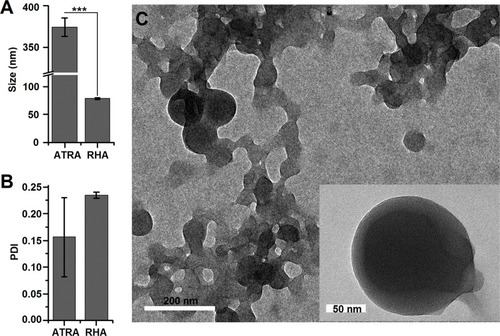
Figure 2 (A) IC50 values of RHA nanoparticles against 4 cancer cell lines. (B) Proliferation of A-375 cells after treatment with 12.5 μM and 25.0 μM of RHA nanoparticles or ATRA, respectively, for 48 hrs. Data are shown as mean with SD error bars (n = 4). Significance difference: *** (P < 0.001).
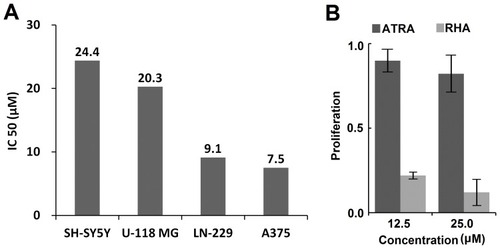
Figure 3 (A) Cell cycle analysis and (B) apoptotic cell proportion of A-375 cells treated with various concentrations of RHA nanoparticles for 48 hrs.
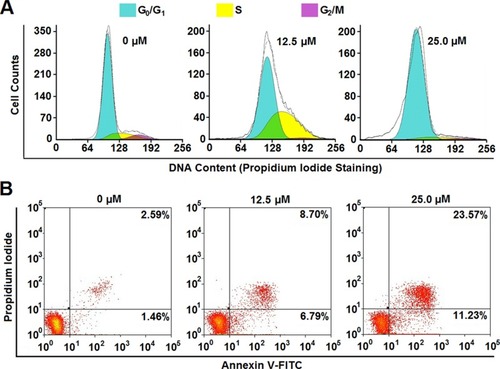
Figure 4 (A) Viability and (B) viable cells of A-375 cells after RHA withdrawal. Cells were pre-treated with 25 μM of RHA nanoparticles for 48 hrs. (C) Image and (D) foci counts of colony formation of A-375 cells pre-treated with 25 μM of RHA nanoparticles for various days. Data were shown as mean with SD error bars (n=3). Significance difference: ** (comparing with 0 hrs, P < 0.01) and *** (comparing with 0 hrs, P < 0.001).
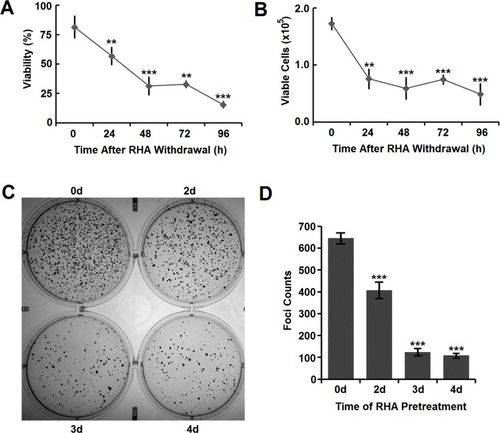
Figure 5 Dynamic in vivo distribution of RHA nanoparticles and poloxamer-coated RHA nanoparticles observed using 0.5% (mol/mol) hexadecylamine-modified Cy7 (HA-Cy7) as tracer. A single dose of nanoparticles or HA-Cy7 was administered intravenously. Yellow circle indicated the location of tumors, while red one indicated the location of livers.
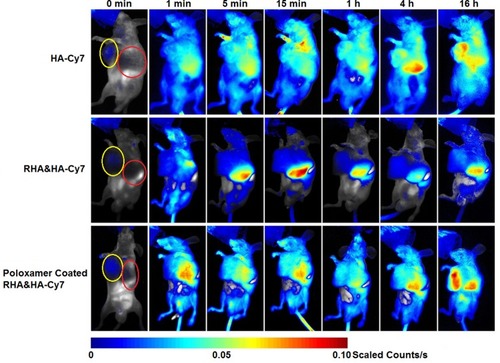
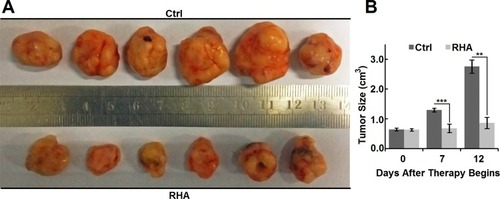
Figure 6 (A) Appearance and (B) size of Balb/c-nu mice tumors treated with vehicle or RHA nanoparticles. Vehicle or 10 mmol/kg RHA nanoparticles were administrated intravenously every 2 days from the 14th day to 24th day of A-375 cell presentation. Data are shown as mean with SD error bars (n = 6). Significance difference: ** (P < 0.01) and *** (P < 0.001).