Figures & data
Figure 1 (A) The TEM images and (B) the average size of ZrO2 by Zetasizer 3000HSA.
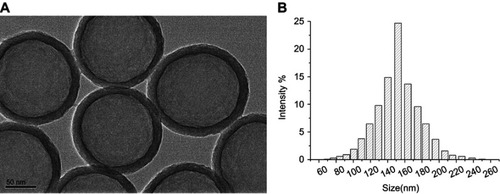
Figure 2 Complete blood counts of ICR mice following injection of ZrO2. Mean and standard deviation of red blood cell (RBC) numbers, hemoglobin concentration (HGB), hematocrit (HCT), mean corpuscular volume (MCV), mean corpuscular hemoglobin (MCH), mean corpuscular hemoglobin concentration (MCHC), white blood cells (WBC) or platelet (PLT) of ICR mice (n ¼ 10). No statistically significant changes were observed between groups, with the exception of significant spread in WBC counts in 500 dose group of ZrO2 particles (*denotes statistical significance for the comparison of control, *p<0.05).
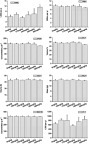
Figure 3 Biochemistry indexes of ICR mice following single injection of ZrO2. Mean and standard deviation of alanine aminotransferase (ALT), aspartate aminotransferase (AST), blood urea nitrogen (BUN) and creatinine (CREA) of ICR mice (n=10 per group). The serum ALT level of the 500 mg/kg groups increased significantly (p<0.05) comparing with control. (*denotes statistical significance for the comparison of control, *p<0.05).
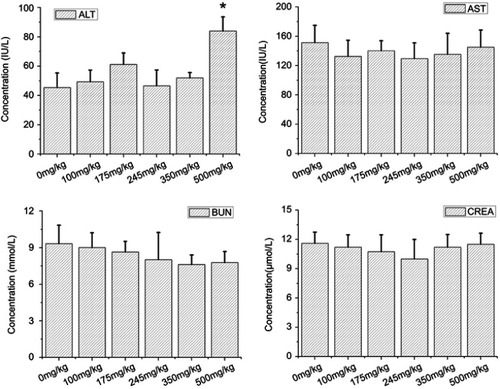
Figure 4 Hematoxylin and eosin-stained images of the liver from control (A) and mice injected ZrO2 at the dose 100 mg/kg (B), 350 mg/kg (C) and 500 mg/kg (D). Black arrow indicates lymphocytic infiltration. (Bar is 100 μm).
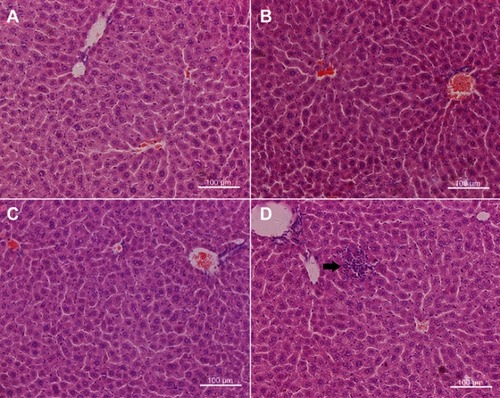
Figure 5 Hematoxylin and eosin-stained images of the kidney from control (A) and mice injected ZrO2 at the dose 100 mg/kg (B), 350 mg/kg (C) and 500 mg/kg (D). (Bar is 100 μm).
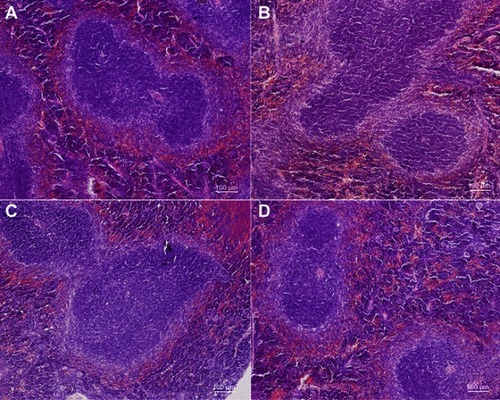
Figure 6 Oxidative stress indexes in the serum of ICR mice following single injection of ZrO2. Mean and standard deviation of SOD, CAT, MDA and GSH of ICR mice (n=5 per group). The serum SOD level of the 350 and 500 mg/kg groups decreased significantly (p<0.05) comparing with control. The CAT level of the 500 mg/kg groups decreased significantly (p<0.05) comparing with control. The MDA level of the 500 mg/kg groups increased significantly (p<0.05) comparing with control. (*denotes statistical significance for the comparison of control, *p<0.05).
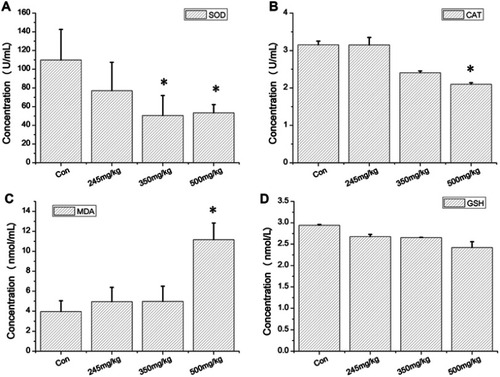
Figure 7 Oxidative stress indexes in the liver of ICR mice following single injection of ZrO2. Mean and standard deviation of SOD, CAT, MDA and GSH of ICR mice (n=5 per group). The SOD level of the 350 and 500 mg/kg groups decreased significantly (p<0.05) comparing with control. The CAT level of the 500 mg/kg groups decreased significantly (p<0.05) comparing with control. The MDA level of the 500 mg/kg groups increased significantly (p<0.05) comparing with control. (*denotes statistical significance for the comparison of control, *p<0.05).
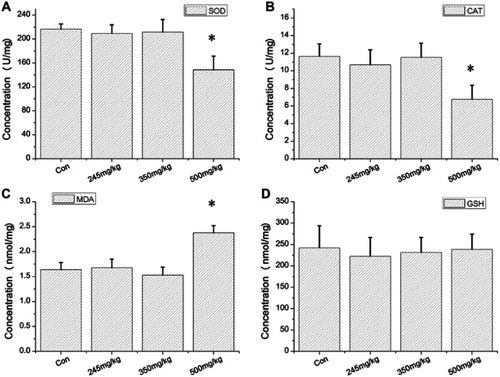
Figure 8 TEM images of treated mice liver (A ×6k, B ×15k and C ×30k) and control group (D ×15k) sacrificed 24 hrs post-injection with ZrO2. Black arrow indicates ZrO2 particles.
Abbreviation: KC, Kupffer cells.
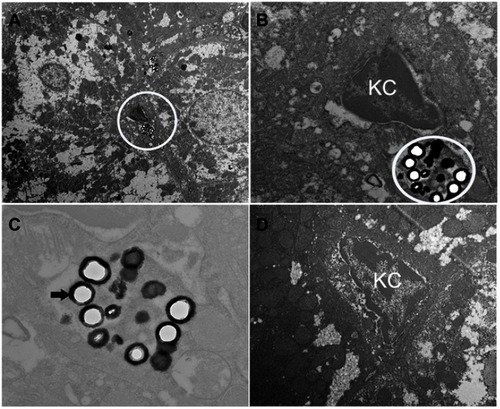
Figure 9 TEM images of treated mice spleen (A, ×6k and B, ×30k) and control group (C, ×15k and D, ×30k) sacrificed 24 hrs post-injection with ZrO2. White arrow indicates ZrO2 particles.
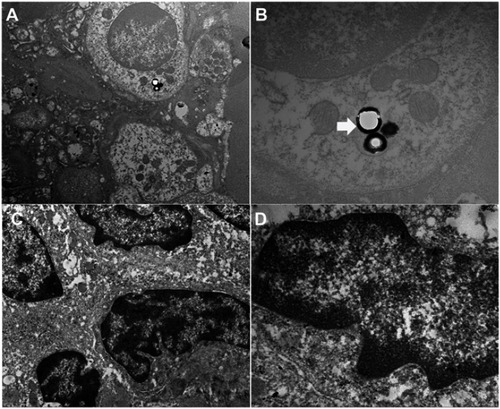
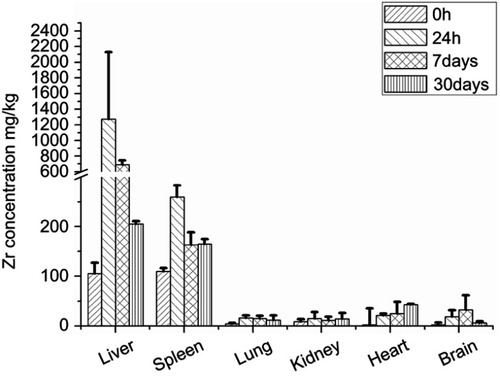
Figure 10 ICP-OES analysis result of Zr levels in liver, spleen, lung, kidney, heart and brain of animals treated with ZrO2 (n=5 per group).