Figures & data
Figure 1 CMC determination of PEG-graft-PLA. (A) Excitation spectra of pyrene from 321 to 340 nm as a function of PEG-graft-PLA concentration in water. (B) Intensity ratio (329/327) of pyrene versus logarithm concentration of PEG-graft-PLA. The CMC was determined by taking the midpoint in the plot of (B), which was 2.0 × 10⁻³ mg/mL.
Abbreviations: CMC, critical micelle concentration; PEG, polyethylene glycol; PLA, polylactic acid.
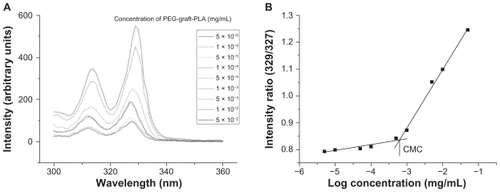
Figure 2 Spherical morphology of nude NPs (A) and NPs encapsulated with insulin (B) or naproxen (C) observed via transmission electron microscopy.
Note: Scale bar: 200 nm.
Abbreviation: NP, nanoparticle.
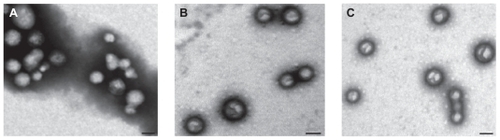
Figure 3 Particle size (top figures), its polydispersity (the value above the column on the top figures) and zeta potential (bottom figures) of nude NPs (A), NPs encapsulated with insulin (B) or naproxen (C), with or without dilution and pH changes, tested by dynamic light scattering.
Abbreviation: NP, nanoparticle.
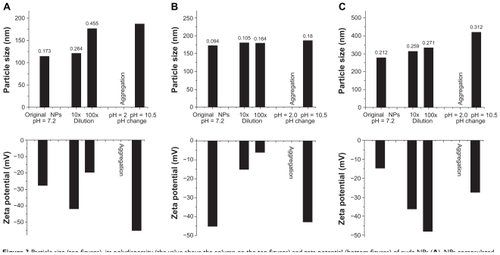
Figure 4 Typical in vitro insulin (A) (tested with Coomassie brilliant blue coloration method) and naproxen (B) release profile from nanoparticles of PEG-graft-PLA.
Abbreviations: PEG, polyethylene glycol; PLA, polylactic acid.
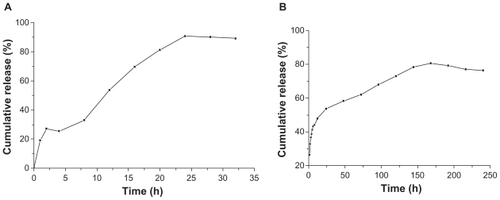
Figure 5 The bioactivity of insulin versus time in PBS and NPs/PBS solution (A), as well as released from the NPs calculated by the bioactivity in NPs/PBS solution minus the bioactivity in PBS (B).
Abbreviations: NP, nanoparticle; PBS, phosphate buffered saline.
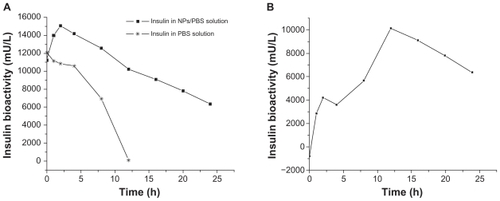
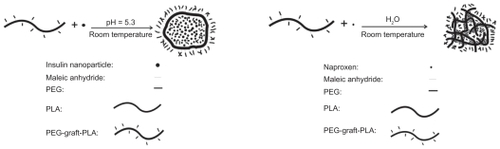
Figure 6 The formation of PEG-graft-PLA NPs when loaded with insulin (A) and naproxen (B).
Abbreviations: PEG, polyethylene glycol; PLA, polylactic acid.