
Figures & data
Table 1 Characterization of the maghemite (γ-Fe2O3) nanoparticles functionalized with citrate ions (NpCit) and the magnetic colloidal suspension
Figure 1 (A) TEM micrograph (scale bar: 200 nm) and (B) histogram of MNP size distribution.
Abbreviations: TEM, transmission electron microscopy; MNP, magnetic nanoparticle.
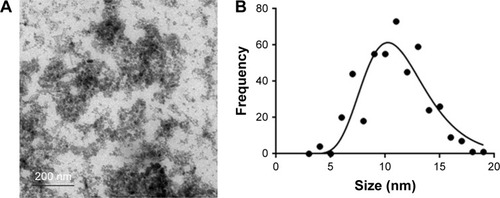
Table 2 Biochemical analysis of the elderly and young mice after treatment with NpCit (2.4 mg iron)
Table 3 Effects of NpCit (2.4 mg iron) treatment on the leukogram and platelet parameters of elderly and young mice
Table 4 Erythrogram analysis of the elderly and young mice observed at different time points after NpCit (2.4 mg iron) administration
Figure 2 Effects of NpCit (2.4 mg iron) injection on the TNF-α and NO levels in serum of elderly and young mice.
Notes: (A) TNF-α levels were detected by ELISA and (B) NO levels were detected by Griess assay. Asterisks indicate significant (*P<0.05) and highly significant (**P<0.01) differences.
Abbreviations: NpCit, nanoparticles coated with citrate; TNF-α, tumor necrosis factor alpha; NO, nitric oxide; EC, elderly control; E1, E7, and E28, elderly groups investigated at day 01, day 07, and day 28 after NpCit treatment, respectively; YC, young control; Y1, Y7, and Y28, young treated groups investigated at day 01, day 07, and day 28, respectively.
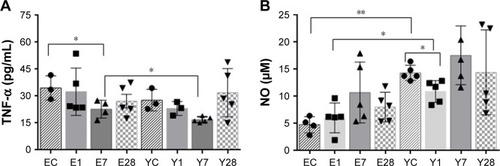
Figure 3 Biodistribution of iron as obtained by inductively coupled plasma optical emission spectrometry (ICP-OES).
Notes: Concentration of iron in the blood (µg/mL) (A) and in the organs (µg/g) in decreasing order from spleen to brain (B–F). Asterisks indicate significant (*P<0.05) and highly significant (**P<0.01) differences.
Abbreviations: EC, elderly control; E1, E7, and E28, elderly groups investigated at day 01, day 07, and day 28 after NpCit treatment, respectively; YC, young control; Y1, Y7, and Y28, young treated groups investigated at day 01, day 07, and day 28, respectively.
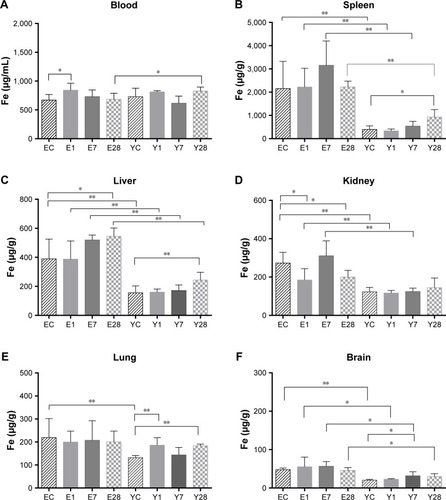
Figure 4 Effects of NpCit on iron distribution of elderly (left column) and young (right column) animals. Organ sections of elderly control animals without treatment are presented in the central column. Histological sections of spleen, liver, kidneys, lungs, and brain were submitted to Perls’ blue staining. Arrows indicate blue positive aggregates which are more evident in the spleen. Micrographs are illustrative and were taken at day 7 and day 28 of treatment, respectively, from elderly and young animals. Scale bar =50 µm.
Abbreviation: NpCit, nanoparticles coated with citrate.
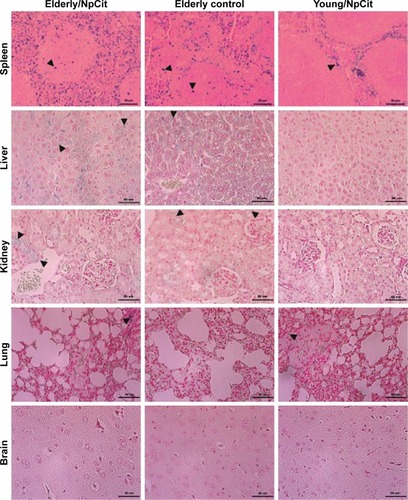
Table 5 Nanoparticle investigations in aged organisms
Table S1 Summary of effects of aging and/or NpCit treatment in mice