Figures & data
Figure S1 Schematic drawing of the HSA-DFO-probe labeled with 89Zr or FITC.
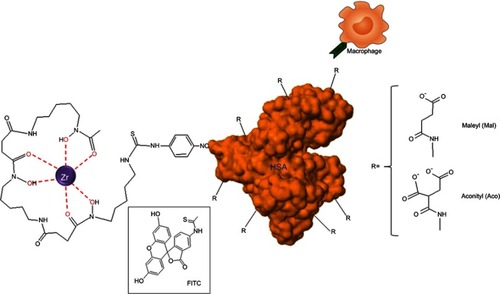
Figure 1 Evaluation of probe uptake in THP-1 macrophages.
Notes: (A) Flow cytometry analysis of uptake of three different concentrations (0.1 μM, 1 μM and 5 μM) of FITC-conjugated probes. Significantly higher uptake of Mal-HSA-FITC and Aco-HSA-FITC than of HSA-FITC by THP-1 macrophages was observed for all tested concentrations. Uptake of Mal-HSA showed significantly higher FITC MFI than that of Aco-HSA at all tested concentrations. The FITC MFI increased significantly with increasing concentrations of each probe P<0.0001. The results are pooled data from two independent experiments (triplicate wells). Data are presented as mean FITC MFI ± SD. ****P<0.0001 for Mal-HSA vs HSA; ###P<0.001, ####P<0.0001 for Aco-HSA vs HSA; §§§§P<0.0001 for Mal-HSA vs Aco-HSA (ordinary two-way ANOVA (factors: treatment and concentration) and Tukey’s multiple comparison test). (B) Confocal Z-stack maximum intensity projection images; left panel: (0.1 μM) HSA-FITC incubation, right panel (0.1 μM) Mal-HSA-FITC. Images show probes (FITC green), actin staining (phalloidin, TRITC red), cell nuclei staining (DAPI, blue).
Abbreviations: HSA, human serum albumin; MFI, median fluorescence intensity.
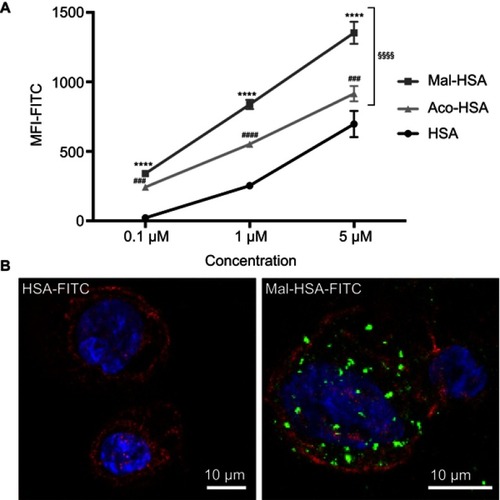
Figure 2 A representative confocal image of THP-1 macrophages showing yellow clusters of colocalized Mal-HSA-FITC (green) probe and LAMP2 lysosome staining (red—Alexa Fluor 568) shown in the merged image. The white lines outline the area of colocalization and enhanced images of orthogonal views.
Abbreviation: HSA, human serum albumin.
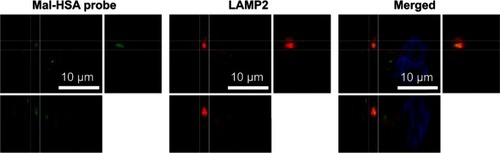
Figure 3 Real-time microscopy comparing Mal-HSA-FITC uptake by THP-1 macrophages with that by THP-1 foam cells over 24 h.
Notes: (A) A significant difference between the time-dependent Mal-HSA-FITC uptake by THP-1 foam cells and THP-1 macrophages was noted by comparing the slope coefficients. No uptake of HSA-FITC probes (gray lines) was observed in either cell subtype. The results shown are pooled data from two independent experiments (triplicate wells). Nine images per well were acquired for each time point. The graph shows mean and SEM. Linear regression analysis showed significantly different slopes of the lines for THP-1 macrophages and THP-1 foam cells (****P<0.0001). (B, C) Light microscopy images were taken after ORO-staining (red) with a 20× objective of (B) THP-1 macrophages and (C) THP-1 foam cells, showing stronger ORO-staining compared with THP-1 macrophages.
Abbreviations: HSA, human serum albumin; GCU, green calibration unit; ORO, Oil-Red-O.
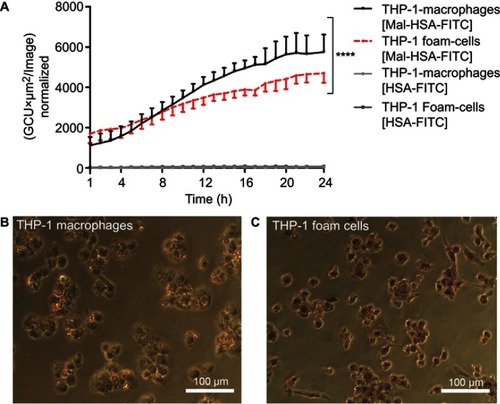
Figure 4 Flow cytometry analysis of uptake of FITC-conjugated probes after 1h incubation, showing a significant 30% decrease in modified HSA probe uptake when MSR1 (SR-A1 gene) was silenced in THP-1 macrophages.
Notes: No significant decrease in modified HSA probe uptake was observed when CD36 and ORL1 (LOX-1 gene) receptor expression was silenced. The results shown are pooled data from two independent experiments (triplicate wells). Data are presented as mean fold change in FITC MFI and SD. **P<0.01, ****P≤0.0001 (ordinary one-way ANOVA and Dunnett’s multiple comparison test (siRNA compared with siNeg control)).
Abbreviations: HSA, human serum albumin; siNeg, siNegative; MFI, median fluorescence intensity.
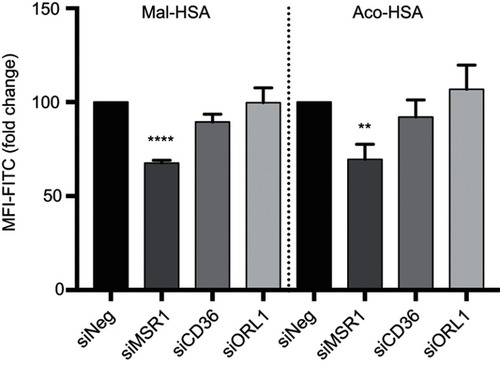
Figure S2 Receptor silencing. (A–C) represent comparisons of qPCR data and fold changes in siRNA levels for MSR1, CD36 and ORL1 for two different silencers per gene. Data showed a 60–80% reduction compared with siNeg control. (D–F) show immunoblotting data for the same siRNAs. (G–I) Band intensities were measured in Fiji ImageJ.
Notes: Bar charts show the decrease in protein expression levels after silencing presented as arbitrary units (AU) and normalized for loading controls. The results are pooled data from two independent experiments (technical duplicates) with mean and SD. *P<0.05, **P<0.01, ****P≤0.0001 (ordinary one-way ANOVA and Dunnett’s multiple comparison test (siRNA compared with siNeg)).
Abbreviation: siNeg, siNegative.
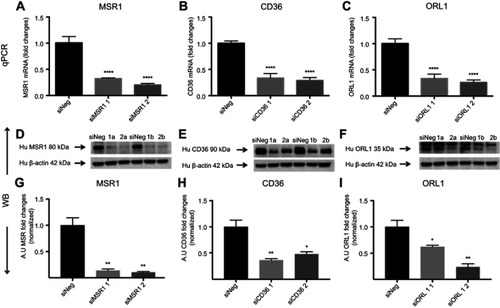
Figure S3 Blocking of phagocytic activity. Confocal images of THP-1 macrophages incubated with Mal-HSA-FITC for 3 h and pretreated with (A) vehicle, (B) DexS or (C) Cyt-D for 30 min.
Notes: Nuclear staining DAPI (blue), FITC-conjugated Mal-HSA (green). (D) Data showed a significant decrease in cellular uptake of FITC-labeled Mal-HSA probes pretreated with DexS or Cyt-D. No uptake of FITC-labeled HSA probes was observed (results not shown). Results shown are pooled data from technical duplicates (5 images/well) presented as mean and SD. *P<0.05 (unpaired t-test with Welch’s correction).
Abbreviations: DexS, dextran sulfate; Cyt-D, cytochalasin D.
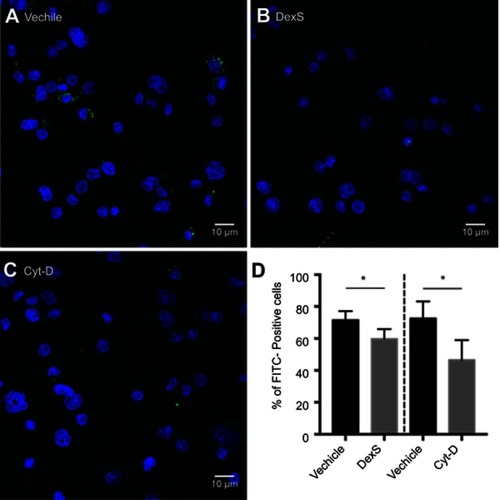
Figure 5 Flow cytometry analysis of FITC-conjugated probe uptake in relation to the addition of increasing concentrations of MDA-LDL (x=0.1 μM). MDA-LDL competed with Mal- and Aco-HSA for receptor-mediated uptake via SR-A1.
Notes: Addition of twice the concentration of MDA-LDL resulted in significant 40% and 53% decreases in the uptake of Mal-HSA and Aco-HSA, respectively compared with baseline (0.1 μM of modified HSA probe) after 1 h incubation. No significant competition was observed with oxLDL. The results shown are pooled data from two independent experiments (triplicate wells). Data are presented as mean FITC MFI and SD. *P<0.05, **P<0.01, ****P≤0.0001 (ordinary one-way ANOVA and Dunnett’s multiple comparison test). Each probe was analyzed separately.
Abbreviation: MFI, median fluorescence intensity.
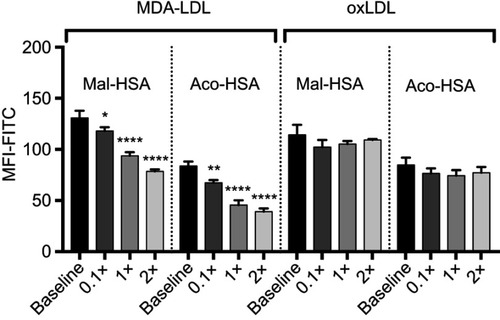
Figure S4 Flow cytometry analysis of FITC-conjugated probe uptake in the presence of increasing concentrations of native LDL.
Notes: Data are presented as mean FITC MFI and SD. No significant competition was observed with native LDL (x=0.1 μM) (ordinary one-way ANOVA).
Abbreviation: MFI, median fluorescence intensity.
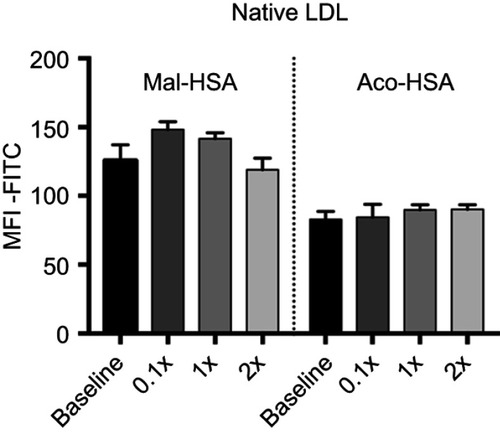
Figure 6 Evaluation of radiolabeled probes by 89Zr-gamma radiation measurements.
Notes: (A) Uptake of modified HSA probes by THP-1 macrophages was already detectable at 15 min and increased over time. All modified probes 89Zr-Mal-HSA and 89Zr-Aco-HSA showed significant differences compared with 89Zr-HSA. **P<0.01, ***P<0.001, ****P<0.0001 for Mal-HSA vs HSA; #P<0.05, ####P<0.0001 for Aco-HSA vs HSA, §§§§P<0.0001 for Mal-HSA vs Aco-HSA (ordinary two-way ANOVA (factors: treatment and time) and Tukey’s multiple comparisons test). (B) In vitro blocking: Uptake of 89Zr-Mal-HSA and 89Zr-Aco-HSA decreased approximately 60% and 40%, respectively, after 15 min blocking followed by 1 h probe incubation. No significant differences were observed between HSA and HSA-block. (ns=nonsignificant **P<0.01, ***P<0.001 (unpaired t-test with Welch’s correction). The results shown in (A) and (B) are pooled data from two independent experiments (triplicate wells). Data show mean percentage uptake of added radioactivity per 100,000 cells and SD.
Abbreviation: HSA, human serum albumin.
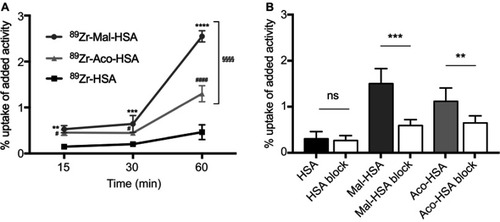
Figure 7 Flow cytometry analysis of probe uptake in three different types of polarized macrophages.
Notes: M0 and M2 take up Mal-HSA probes significantly better than M1 after 1 h probe incubation. No significant differences were observed between M0 and M2 cells incubated with Mal-HSA-FITC. The results represent data from six donors in technical duplicates. Data are presented as mean FITC MFI and SD. ****P<0.0001 (ordinary two-way ANOVA (factors: treatment and cell phenotype) and Tukey’s multiple comparison test).
Abbreviations: HSA, human serum albumin; MFI, median fluorescence intensity.
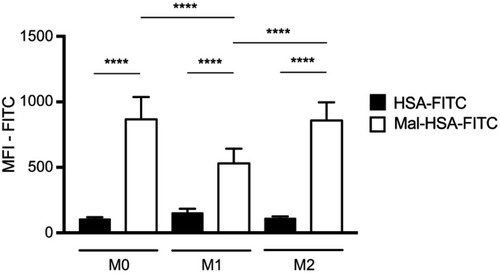
Figure 8 Receptor blocking. Evaluation of Mal-HSA-FITC uptake over time by human primary macrophages measured by real-time microscopy.
Notes: (A) M0, (B) M1 and (C) M2 polarized macrophages preincubated with either vehicle control (dashed line), anti-SR-A1 blocking antibody (red), or IgG1 isotype control (continuous line). (D) Comparison of the uptake capability of differently polarized macrophages. The results represent data from three donors in technical triplicates (9 images/well and timepoint) and are presented as mean and SEM. In (A–C): *P<0.05, **P<0.01, ***P<0.001, ****P<0.0001 for vehicle vs anti-SR-A1; #P<0.05, ##P<0.01, ###P<0.001, ####P<0.0001 for IgG vs anti-SR-A1. In (D) ****P<0.0001 for M0 vs M1; #P<0.05, ##P<0.01, ###P<0.001 for M0 vs M2; §P<0.05, §§§P<0.001 for M2 vs M1 (repeated measures two-way ANOVA (factors: treatment and time) and Tukey’s multiple comparison test).
Abbreviations: HSA, human serum albumin; GCU, green calibration unit.
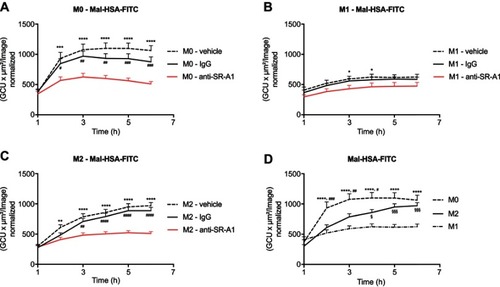
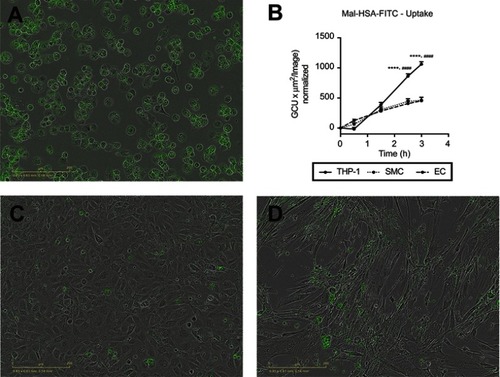
Figure 9 Evaluation of Mal-HSA-FITC uptake by different cell types. Fluorescence microscopy images of Mal-HSA-FITC probes (green) incubated for 3 h with (A) THP-1 macrophages, (C) HUVECs (EC), and (D) HCtSMCs (SMC). (B) Mal-HSA-FITC uptake by different cell types plotted against time. The results represent data from technical triplicates (9 images/well and timepoint) and are presented as mean and SEM. Data show significantly increased uptake of modified HSA probes by THP-1 cells compared with HUVEC (****P<0.0001) and HCtSMCs (####P<0.0001) at 2.5 h and 3 h. None of the cell types recognized HSA-FITC (data not shown) (repeated measures two-way ANOVA (factors: cell type and time) and Tukey’s multiple comparison test).
Abbreviations: HSA, human serum albumin; GCU, green calibration unit.