Figures & data
Table 1 Physicochemical characteristics of liposome formulations (mean ± SD, n=3)
Figure 1 Particle size and polydispersity index of OTR-Lipo (A, B) and ATO-Lipo (C, D) over a period of 12 weeks.
Note: The results are represented as mean ± SD of three independent experiments (P>0.05, ANOVA).
Abbreviations: OTR-Lipo, PEGylated immunoliposomes conjugated with anti-oxytocin receptor monoclonal antibodies; ATO-Lipo, atosiban-conjugated PEGylated liposomes.
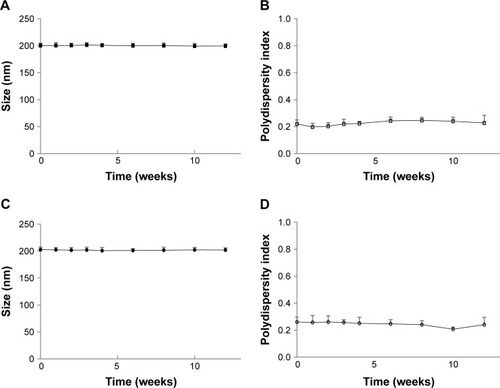
Figure 2 Stability of nifedipine-loaded OTR-Lipo (A), nifedipine-loaded ATO-Lipo (B), salbutamol-loaded OTR-Lipo (C), and salbutamol-loaded ATO-Lipo (D) in PBS pH 7.4 and 50% FBS at 37°C.
Notes: The data represent the mean ± SD of three independent experiments. One-way ANOVA with Tukey’s multiple comparison test was used to assess drug retention at various time points compared to their respective baseline values (*P<0.05, **P<0.01, ***P<0.001, ****P<0.0001).
Abbreviations: OTR-Lipo, PEGylated immunoliposomes conjugated with anti-oxytocin receptor monoclonal antibodies; ATO-Lipo, atosiban-conjugated PEGylated liposomes.
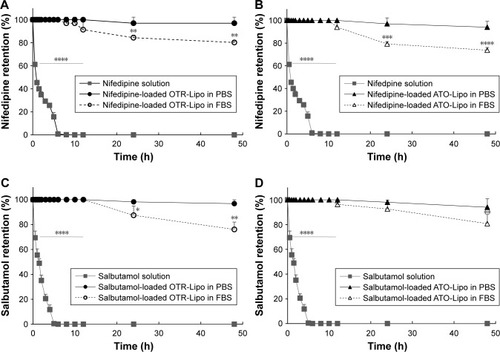
Figure 3 Representative AFM images of OTR-Lipo (A), ATO-Lipo (B), rabbit IgG immunoliposomes (C), and conventional liposomes (D).
Note: Scale bars correspond to 50 nm.
Abbreviations: AFM, atomic force microscopy; OTR-Lipo, PEGylated immunoliposomes conjugated with anti-oxytocin receptor monoclonal antibodies; ATO-Lipo, atosiban-conjugated PEGylated liposomes.
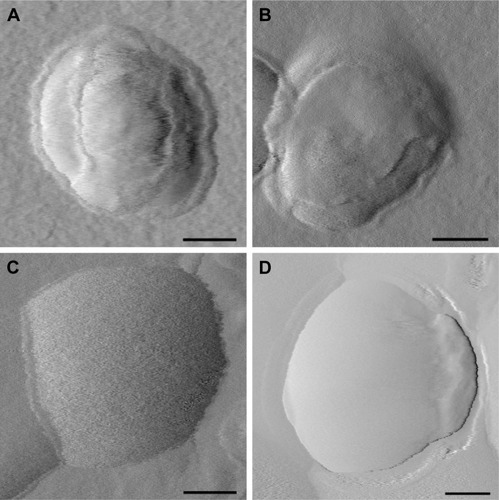
Figure 4 Concentration-dependent binding of OTR-Lipo and ATO-Lipo to hTERT-myo cells.
Notes: Conventional liposomes and rabbit IgG immunoliposomes were used as controls. Competitive inhibition of binding of OTR-targeted liposomes was also evaluated following preincubation with excess anti-OTR monoclonal antibody. Liposomes were incubated for 1 hour at 4°C. The results are represented as mean ± SEM of six independent experiments. Two-way ANOVA with Tukey’s multiple comparison test was used to assess intergroup differences at various concentrations (****P<0.0001).
Abbreviations: SEM, standard error of the mean; OTR-Lipo, PEGylated immunoliposomes conjugated with anti-oxytocin receptor monoclonal antibodies; ATO-Lipo, atosiban-conjugated PEGylated liposomes.
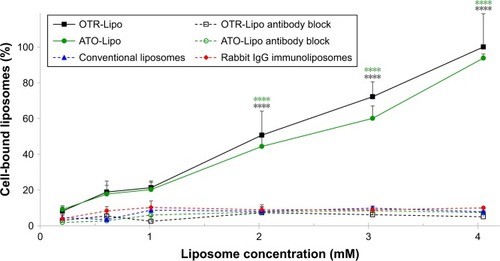
Figure 5 Cellular association of OTR-Lipo, ATO-Lipo, rabbit IgG immunoliposomes and conventional liposomes by hTERT-myo cells.
Notes: Liposomes were incubated at 2.02 mM (A) and 4.05 mM (B) for 1 hour at 37°C. The results are represented as mean ± SEM of six independent experiments. Two-way ANOVA with Tukey’s multiple comparison test was used to assess intergroup differences in cell binding and internalization, as well as individual group differences between cell binding and internalization (****P<0.0001).
Abbreviations: SEM, standard error of the mean; OTR-Lipo, PEGylated immunoliposomes conjugated with anti-oxytocin receptor monoclonal antibodies; ATO-Lipo, atosiban-conjugated PEGylated liposomes.
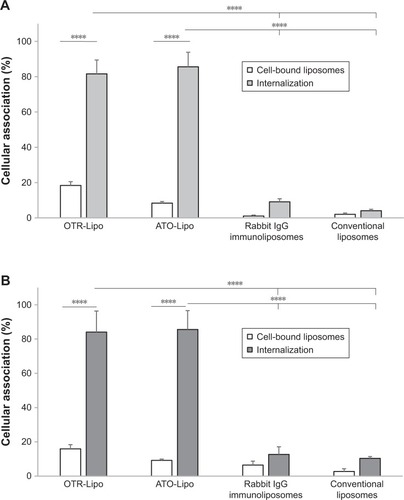
Figure 6 Cellular uptake of OTR-Lipo and ATO-Lipo following preincubation with various concentrations of pharmacological inhibitors of clathrin-mediated endocytosis (A, B and C).
Notes: Liposomes were incubated at 2.02 mM for 1 hour at 37°C. The results are represented as mean ± SEM of six independent experiments. One-way ANOVA with Tukey’s multiple comparison test was used to assess inhibition of cellular uptake of OTR-targeted liposomes and positive control (transferrin) in the presence of various concentrations of inhibitors compared to their respective baseline values (**P<0.01, ***P<0.001, ****P<0.0001).
Abbreviations: SEM, standard error of the mean; OTR-Lipo, PEGylated immunoliposomes conjugated with anti-oxytocin receptor monoclonal antibodies; ATO-Lipo, atosiban-conjugated PEGylated liposomes.
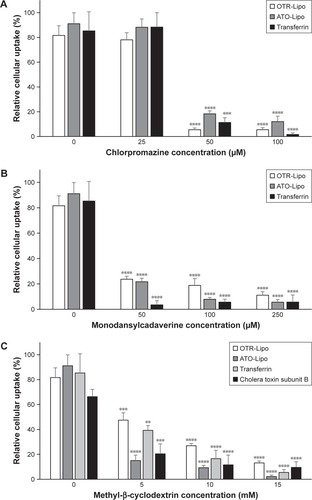
Figure 7 Cellular uptake of OTR-Lipo and ATO-Lipo following preincubation with various concentrations of pharmacological inhibitors of caveolin-mediated endocytosis (A and B) and macropinocytosis and phagocytosis (C and D).
Notes: Liposomes were incubated at 2.02 mM for 1 hour at 37°C. The results are represented as mean ± SEM of six independent experiments. One-way ANOVA with Tukey’s multiple comparison test was used to assess inhibition of cellular uptake of OTR-targeted liposomes and positive control (cholera toxin subunit B or 1 µm microspheres) in the presence of various concentrations of inhibitors compared to their respective baseline values (**P<0.01, ***P<0.001, ****P<0.0001).
Abbreviations: SEM, standard error of the mean; OTR-Lipo, PEGylated immunoliposomes conjugated with anti-oxytocin receptor monoclonal antibodies; ATO-Lipo, atosiban-conjugated PEGylated liposomes.
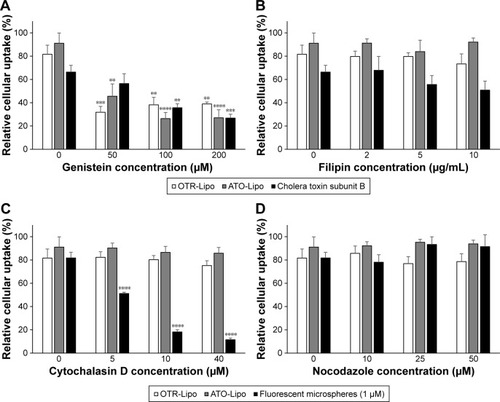
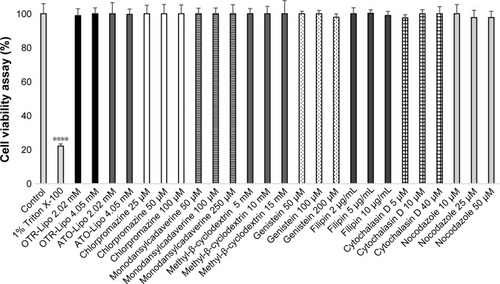
Figure 8 Cell viability following exposure to OTR-targeted liposomes and specific endocytotic inhibitors at various concentrations for 24 and 1.5 hour, respectively.
Notes: Triton X-100 (1% in PBS) was used as a positive control. Two-way ANOVA with Tukey’s multiple comparison test was used to assess cell viability at various concentrations compared to healthy control cells (****P<0.0001).
Abbreviations: OTR-Lipo, PEGylated immunoliposomes conjugated with anti-oxytocin receptor monoclonal antibodies; ATO-Lipo, atosiban-conjugated PEGylated liposomes.