Figures & data
Table S1 Clinical characteristics of breast cancer group patients.
Table S2 Clinical characteristics of colorectal cancer group patients.
Table S3 Clinical characteristics of lung cancer group patients.
Table S4 Clinical characteristics of ovarian cancer group patients.
Table S5 Clinical characteristics of oral cancer group patients
Table S6 Demographic information of healthy controls.
Figure 1 The mean surface-enhanced Raman scattering (SERS) spectra of serum from controls and breast, colorectal, lung, ovarian and oral cancer samples (all types combined) and their spectral difference. All SERS spectra were mean normalized and for each spectrum, two measurements were averaged.
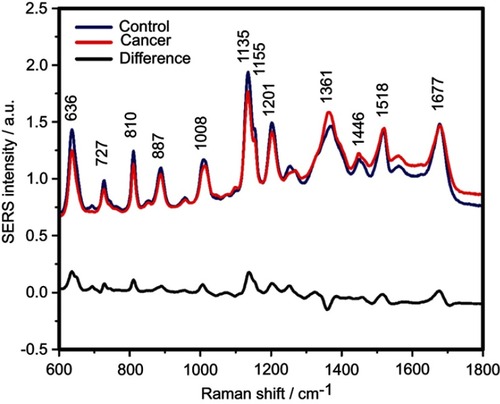
Figure 2 The results provided by the five principal component analysis–linear discriminant analysis (PCA-LDA) models, which compared control samples versus breast, colorectal, lung, ovarian and oral cancer samples. PPV denotes the positive predictive value, while NPV refers to the negative predictive value. The number of principal components (PCs) was chosen such that the sensitivities and specificities for predicting on the validation sets were similar to the ones of the resubstitution analysis.
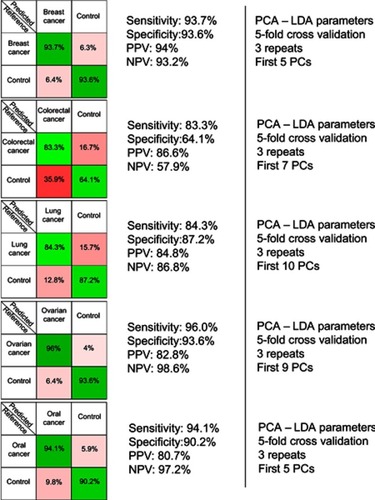
Figure 3 The results of the principal component analysis–linear discriminant analysis (PCA-LDA) for all cancer types combined (breast, colorectal, lung, ovarian and oral cancer). PPV denotes the positive predictive value, while NPV refers to the negative predictive value. The number of principal components (PCs) was chosen such that the sensitivities and specificities for predicting on the validation sets were similar to the ones of the resubstitution analysis.
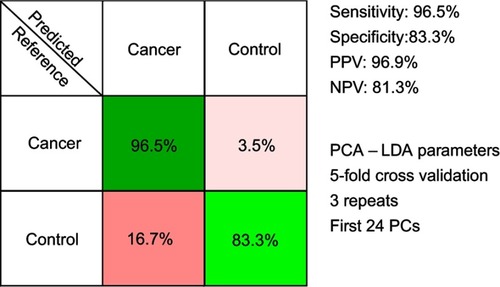
Figure 4 The results of the principal component analysis–linear discriminant analysis (PCA-LDA) that assessed the differential diagnosis between controls and breast, colorectal, lung, ovarian and oral cancer. PPV denotes the positive predictive value, while NPV refers to the negative predictive value. The number of principal components (PCs) was chosen such that the sensitivities and specificities for predicting on the validation sets were similar to the ones of the resubstitution analysis. The figures of merit represent the accuracy to distinguish between control samples and all types of cancer combined.
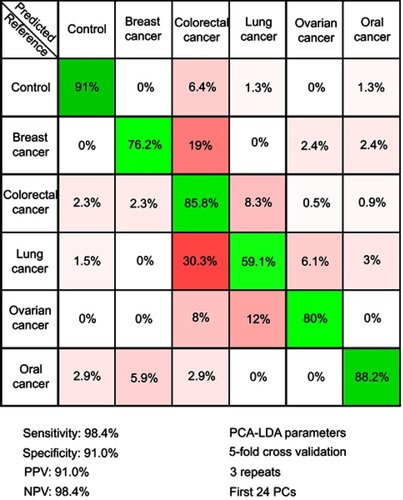
Figure S1 The physical properties of silver nanoparticles used for acquiring surface-enhanced Raman scattering (SERS) spectra of serum samples. The UV-Vis spectrum (A) and a representative transmission electron microscopy image (B) of the silver nanoparticles used for SERS
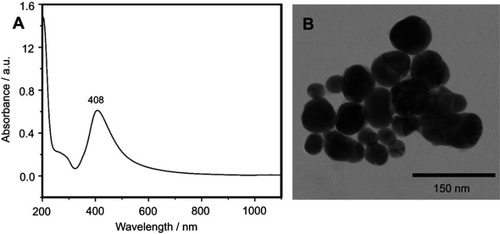
Figure S2 The mean surface-enhanced Raman scattering (SERS) spectra of serum from controls and breast cancer patients and their difference. The SERS spectra were acquired by focusing a 532 nm laser (10 mW) on the samples for 40 s. The SERS spectra were mean normalized and for each spectrum, two measurements were averaged
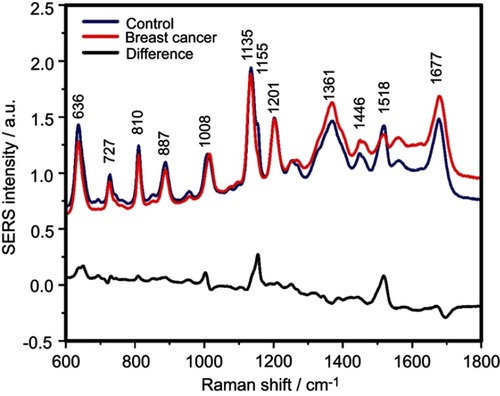
Figure S3 The mean surface-enhanced Raman scattering (SERS) spectra of serum from controls and colorectal cancer patients and their difference. The SERS spectra were acquired by focusing a 532 nm laser (10 mW) on the samples for 40 s. The SERS spectra were mean normalized and for each spectrum, two measurements were averaged
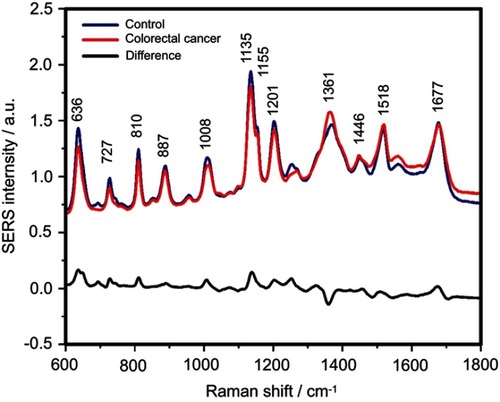
Figure S4 The mean surface-enhanced Raman scattering (SERS) spectra of serum from controls and lung cancer patients and their difference. The SERS spectra were acquired by focusing a 532 nm laser (10 mW) on the samples for 40 s. The SERS spectra were mean normalized and for each spectrum, two measurements were averaged
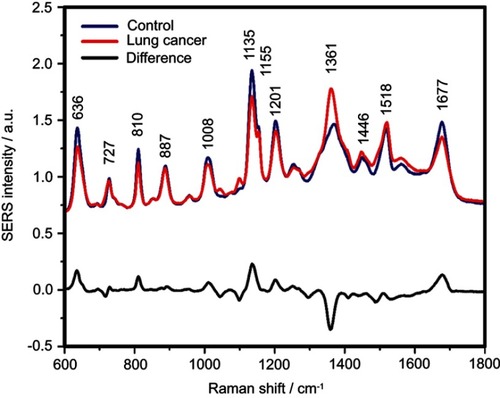
Figure S5 The mean surface-enhanced Raman scattering (SERS) spectra of serum from controls and ovarian cancer patients and their difference. The SERS spectra were acquired by focusing a 532 nm laser (10 mW) on the samples for 40 s. The SERS spectra were mean normalized and for each spectrum, two measurements were averaged
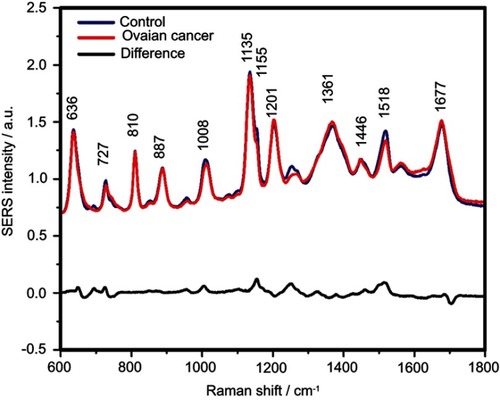
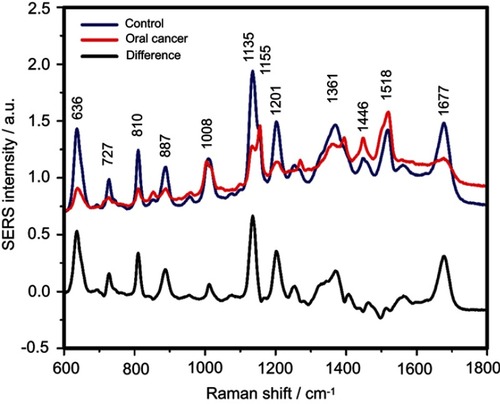
Figure S6 The mean surface-enhanced Raman scattering (SERS) spectra of serum from controls and oral cancer patients and their difference. The SERS spectra were acquired by focusing a 532 nm laser (10 mW) on the samples for 40 s. The SERS spectra were mean normalized and for each spectrum, two measurements were averaged