Figures & data
Figure 1 Characterization of CLPP/mRNA particles. (A) Size distribution of prepared cationic liposome. (B) TEM image of cationic liposome. (C) Identify of survivin-T34A mRNA by electrophoresis. (D) Gel retarding assay of CLPP/mSur-T34A particle. (E) Size distribution of CLPP/mRNA particle. (F) TEM image of CLPP/mRNA particle, core-shell structures could be observed. (G) Cell viability assay of CLPP, PEI25K and Lipo2K on 293T cells.
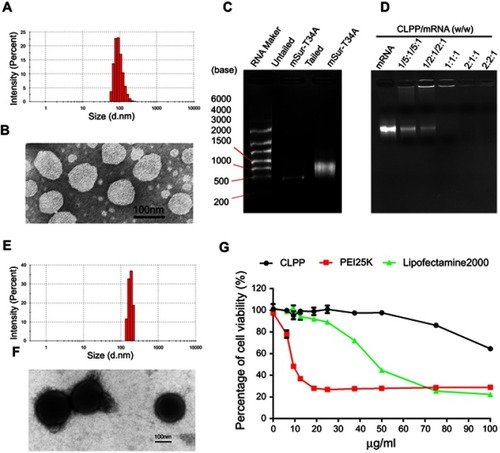
Figure 2 CLPP lipoplex efficiently delivered mRNA in vitro. (A) Transfection efficiency of CLPP/mRNA particle at different time point on C26 cells. (B) Transfection efficiencies of different vectors delivered EGFP mRNA on C26 cells (scale bars, 200 μm). (C) Transfection efficiency and mean fluorescence intensity calculated by flow cytometry. (D) Study of cell uptake mechanism of CLPP/mRNA particle with various inhibitors (scale bars, 50 μm). (E) Cellular internationalization rates under inhibitors detected by flow cytometry. The results are shown as mean ± SEM, *P<0.05, **P<0.01, ***P<0.001 compared to the Ctrl group by two-tailed Student’s t-test.
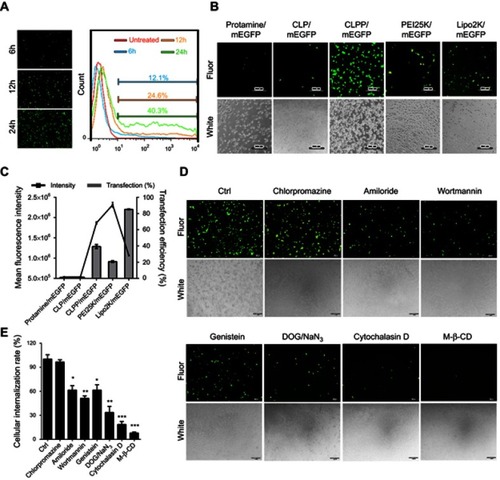
Figure 3 CLPP/mSur-T34A particles inhibited the growth of C26 colon cancer cells in vitro. (A) Cell growth inhibition effect of CLPP/mSur-T34A particle evaluated by MTT assay. (B and C) Inhibition effect of CLPP/mSur-T34A particles was evaluated by clonogenic assay. (B) On 10 days post-transfection, the numbers of clones in each well were counted. (C) Brightfield image of each well. (D and E) CLPP-delivered survivin-T34A mRNA efficiently induced apoptosis in C26 cells. (F–I) 24 hrs post-transfection, the mRNA levels of survivin, caspase9, -3 and -7 were analyzed by RT-PCR (*P<0.05, **P<0.01, ***P<0.001, ns represents no significant difference). For all experiments, results are shown as mean ± SEM.
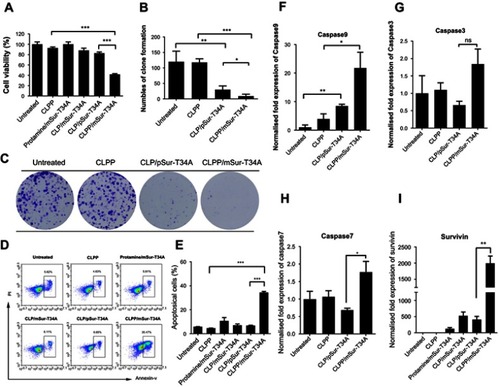
Figure 4 Local delivery of CLPP/mSur-T34A particle inhibited tumor growth in two models. (A) Representative images of abdominal cavity metastases of C26 colon carcinoma (n=6 for each group). The arrows show the tumor nodes. (B) Average tumor weight in abdominal metastases model. (C) Average ascetic volume. (D) Representative images of subcutaneous xenograft of C26 colon cancer (n=4 for each group). A complete regression was observed in CLPP/mSur-T34A group (circle). (E) Tumor growth curves of each group(***P<0.001 vs NS, *P<0.05 vs CLP/pSur-T34A). (F) Average tumor weight. Error bars represent SEM for n=4 and *P<0.05 compared to NS group, **P<0.01 compared to CLPP group.
Abbreviation: NS, normal saline.

Figure 5 CLPP/mSur-T34A particles induced a significant antitumor effect in vivo. (A) Apoptosis-inducing and antiangiogenesis effect detected by TUNEL assay and CD31 staining in tumor tissues in abdominal cavity metastatic model (scale bars, 50 μm). (B) CLPP/mSur-T34A effectively induced caspase-dependent tumor apoptosis. Protein expression of activated caspase9, -3 and -7 in tumor tissues was detected. (C) The mRNA expression of caspase9, -3 and -7 and increased releasing of cytokines including TNF-α, IFN-γ and IL-6 were detected by RT-PCR. (D) Apoptosis and vessels in tumor tissues also evaluated by TUNEL assay (up) and CD31 staining (down) in subcutaneous xenograft (scale bars, 100 μm). (E) Relative expression of survivin in tumor tissue of each group (***P<0.001 vs NS). (F) Elevated mRNA levels of caspase9, -7, -3, TNF-α, IFN-γ and IL-6 were measured by RT-PCR. All data are reported as mean ± SEM (Student’s t-test, ***P<0.001, **P<0.01, *P<0.05).
Abbreviation: NS, normal saline.
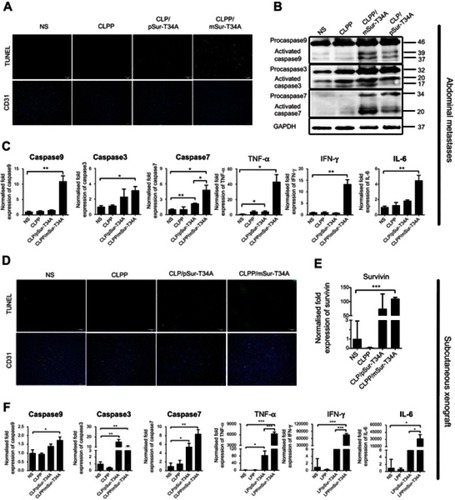
Figure 6 Systemic delivery of CLPP/mSur-T34A particles inhibited pulmonary metastases of C26 colon cancer. (A) Representative images of lung tissues harvested from animals after systemic treatments (n=4 for each group). (B) HE staining of lungs bearing metastases of C26 colon carcinomas in each treatment group (scale bars, 200 μm). Arrows indicate metastases modules in lung tissue. (C) Weight of lungs bearing pulmonary metastases (***P<0.001 vs NS; **P<0.01 vs CLPP). (D) Number of pulmonary metastatic nodules in each treatment group. (E) Inhibition rate calculated by the number of pulmonary metastases according to the number of pulmonary metastases. In this experiment (n=4 for each group, ***P<0.001 vs NS, ***P<0.001 vs CLPP, **P<0.01 vs CLP/pSur-T34A). (F) Apoptosis inducing detected by TUNEL assay. Tumor-rich regions are indicated by arrow direction (scale bars, 100 μm).
Abbreviation: NS, normal saline; Fluor, fluorescence.
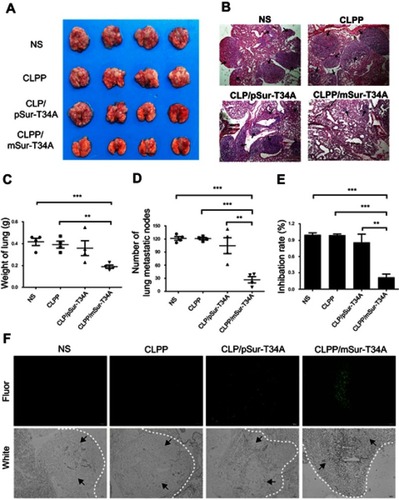
Figure 7 Activation of antitumor immune response by CLPP/mSur-T34A particle. (A) The infiltration of immune cells in abdominal cavity metastatic tumor tissues were detected by immunofluorescence staining. (B) The fluorescent images of CD4+ T cells, CD8+ T cells, CD49b+ NK cells and F4/80+ macrophages in tumor tissues from subcutaneous xenograft tumor model. (C–F) Lymph node-derived immune cells from subcutaneous xenograft tumor model were analyzed. Flow cytometry analysis of CD3+/CD4+/IFN-γ+ T cell, NK cell and macrophages. All data are reported as mean ± SEM and ***P<0.001, **P<0.01, *P<0.05 (two-tailed Student’s t-test).
Abbreviation: NS, normal saline.
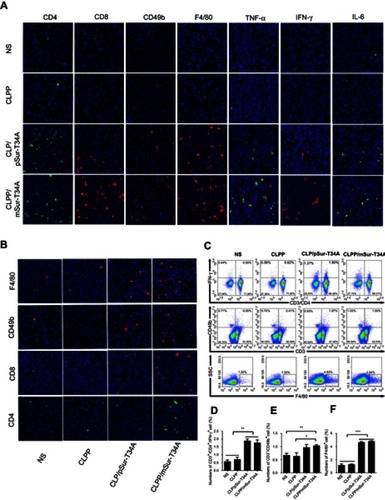
Figure 8 Schematic view of CLPP-based mRNA delivery.
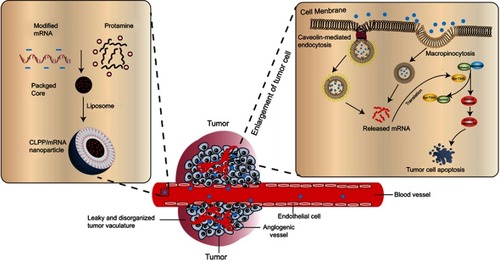
Figure S1 Primer sequences.
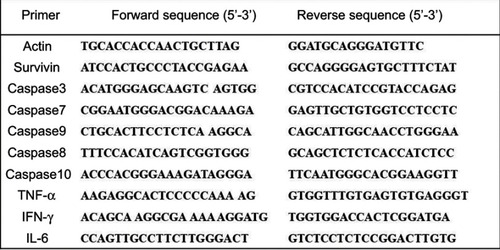
Figure S2 Comparison of plasmid-based gene delivery by different vectors on C26 cells. (A) Images of transfected cells with different materials. (B) Transfection efficiencies calculated by flow cytometry.
Abbreviation: Fluor, fluorescence.
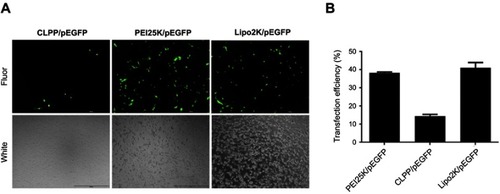
Figure S3 CLPP/mSur-T34A particles efficiently inhibited the growth of C26 cancer cells in vitro. (A) Evaluation of cell growth inhibition by CLPP/mSur-T34A particles after 48 hrs. (B) The change of cell morphology in each group. (C and D) 48 hrs post transfection, CLPP-delivered survivin-T34A mRNA efficiently induced apoptosis in C26 cells. (E and F) In abdominal cavity metastases, treatment with CLPP/mSur-T34A particles increased the mRNA level of caspase8 and caspase10 in tumor tissue. (G) In subcutaneous xenograft model, treatment with CLPP/mSur-T34A particles increased the mRNA level of caspase8 in tumor tissue. All data are reported as mean ± SEM and ***P<0.001, **P<0.01, *P<0.05 (two-tailed Student’s t-test).
Abbreviation: NS, normal saline.
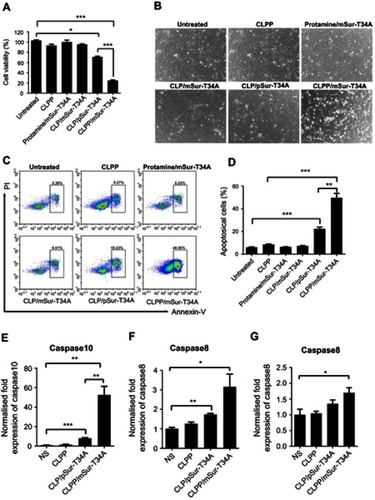
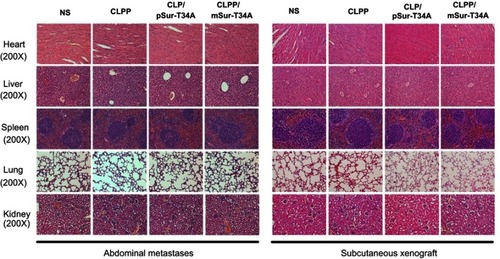
Figure S4 HE analysis of main organs from each treatment group, no obvious pathological changes were observed (magnification =200×).