Figures & data
Figure 1 The viability of NCM460 cells treated with H2O2 and/or SeNPs. (A) NCM460 cells treated with 4 μg Se/mL of SeNPs for 12 hours before being challenged by 500 μM H2O2 for 6 hours. (B) NCM460 cells treated with 500 μM H2O2 for 2, 4, 6, 8, 10 or 12 hours. Cell viability was determined by CCK-8. All data were presented as mean ± SEM of three separate experiments. *P<0.05, **P<0.01.
Abbreviations: H2O2, hydrogen peroxide; SeNPs, selenium nanoparticles; CCK-8, Cell Counting Kit-8; SEM, standard error of mean.
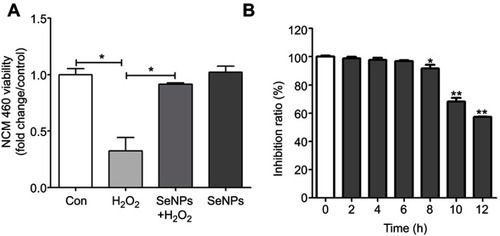
Figure 2 Effect of SeNPs on intestinal epithelial permeability. (A) TER after different treatment in NCM460 cells. (B) Effect of SeNPs on FITC-dextran fluxes across NCM460 cells exposed to H2O2. All data were presented as mean ± SEM of three separate experiments. *P<0.05, **P<0.01.
Abbreviations: Con, control; SeNPs, selenium nanoparticles; TER, transepithelial electrical resistance; FITC, fluorescein isothiocyanate; H2O2,hydrogen peroxide; SEM, standard error of mean.
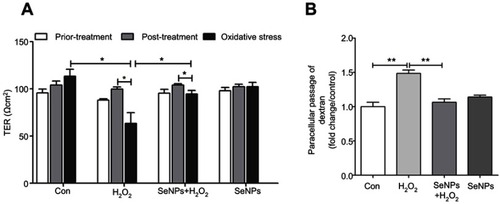
Figure 3 SeNPs inhibit H2O2-induced ROS production. (A) Intracellular ROS were detected by flow cytometry with DCFH-DA staining. (B) Comparative analysis of ROS production. (C) Quantitative analysis of the cellular ROS levels (fold change/control). All data were presented as mean ± S.E.M of three separate experiments. *P<0.05, ***P<0.001.
Abbreviations: Con, control; DFC, 2',7'-dichlorofluorescein; SeNPs, selenium nanoparticles; H2O2, hydrogen peroxide; DCFH-DA, 2ʹ,7ʹ-dichlorodihydrofluorescein diacetate; SEM, standard error of mean.
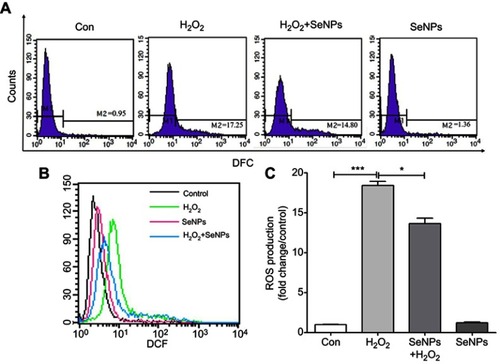
Figure 4 Protective effect of SeNPs on H2O2-induced mitochondrial damage of NCM460 cells. (A) The levels of ATP were measured by ATP assay Kit. (B) Mitochondrial DNA copy number was analyzed by real-time PCR. (C) Quantitative analysis of the cellular mitochondria (fold change/control). (D) Cellular mitochondria were observed by fluorescence microscope with Mito-Tracker Green staining. (E) Mitochondrial ultrastructure of NCM460 cells was observed by TEM. All data were presented as mean ± SEM of three separate experiments. *P<0.05, **P<0.01.
Abbreviations: Con, control; SeNPs, selenium nanoparticles; H2O2, hydrogen peroxide; ATP, adenosine triphosphate; TEM, transmission electron microscopy; SEM, standard error of mean.
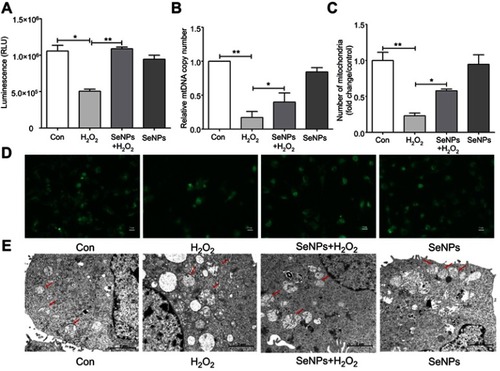
Figure 5 Effect of SeNPs on mitochondrial membrane potential (MMP) of NCM460 cells exposed to H2O2. (A) MMP was detected by an MMP assay Kit with JC-1 staining. MMP was visualized under the confocal microscope. (B) MMP was also measured by Multi-function Microplate Reader. All data were presented as mean ± SEM of three separate experiments. **P<0.01.
Abbreviations: Con, control; SeNPs, selenium nanoparticles; H2O2, hydrogen peroxide; SEM, standard error of mean.
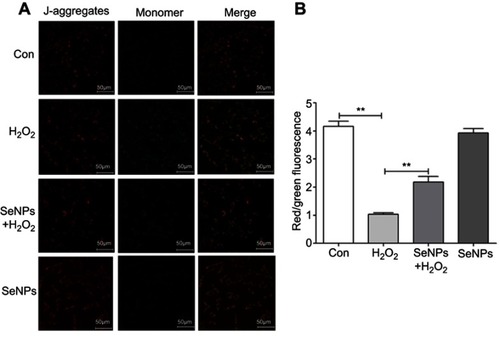
Figure 6 Effect of SeNPs on Nrf2 activation and expression levels of its downstream genes. (A) The protein levels of Nrf2, NQO-1, and HO-1 were detected by Western blot analysis. (B) Quantitative analysis of the protein expression levels of Nrf2, NQO-1, and HO-1. (C) The viability of NCM460 cells treated with Nrf2 inhibitor (ML385) at 0.2, 0.5, 1.5, 2, 4, 6 or 8 µM. (D) Cells were treated with 4 µg/mL of SeNPs and/or 5 µM ML385 for 12 hours, followed by treatment with 500 μM H2O2 for 6 hours. The expression of Nrf2 was determined using Western blot analysis. (E) ML385 abolished the regulatory effect of SeNPs on ROS production. Cells were treated with 4 µg/mL of SeNPs and/or 5 µM ML385 for 12 hours, followed by treatment with 500 μM H2O2 for 6 hours. ROS production was visualized by fluorescence microscopy with DCFH-DA staining. All data were presented as mean ± S.E.M of three separate experiments. *P<0.05, **P<0.01.
Abbreviations: Con, control; SeNPs, selenium nanoparticles; H2O2, hydrogen peroxide; DCFH-DA, 2ʹ,7ʹ-dichlorodihydrofluorescein diacetate; SEM, standard error of mean.
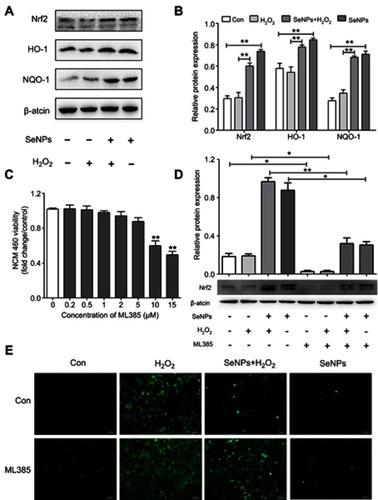
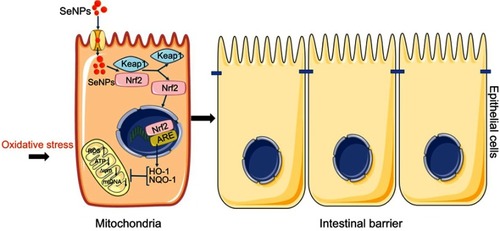
Figure 7 Schematic representation of the proposed mechanism by which biogenic SeNPs synthesized by Lactobacillus casei ATCC 393 protect intestinal epithelial barrier function against oxidative damage. After SeNPs are transported into intestinal epithelial cells, Nrf2 is separated from the Keap1-Nrf2 complex and moved into the nucleus, where it binds to ARE. Transcriptional activation of antioxidant enzymes HO-1 and NQO-1 occurs with the activation of ARE, which function together to inhibit ROS production, weaken the depolarization of MMP, and enhance mitochondrial DNA copy number. In summary, SeNPs exhibit the protective effect on intestinal epithelial barrier function against oxidative damage by alleviating ROS-mediated mitochondrial dysfunction via Nrf2 signaling pathway under oxidative stress.
Abbreviations: SeNPs, selenium nanoparticles; ARE, antioxidant response element; MMP, mitochondrial membrane potential.