Figures & data
Figure 1 SEM images of Ti alloy surface with (A) the self-assembled titania nanotubes (TiO2 NTs), (B) nano zinc oxide (nZnO) grown on the TiO2 NTs without any heat treatment, and nZnO grown on the TiO2 NTs after heating to either (C) 350 ºC, (D) 450 ºC, or (E) 550 ºC. There was no hydroxyapatite added to these samples. The inset in each panel shows the elemental composition of the coatings by electron dispersive spectroscopy (EDS). Images are examples from at least three replicates.
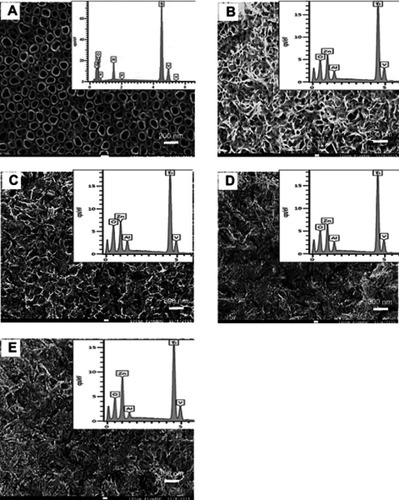
Figure 2 SEM images of HA nanoparticles on top of Ti alloy. (A) The self-assembled titania nanotubes (TiO2 NTs) with hydroxyapatite (HA), (B) nano zinc oxide (nZnO) grown on the TiO2 NTs without any heat treatment, or nZnO grown on the TiO2 NTs after heating to either (C) 350ºC, (D) 450ºC, and (E) 550 ºC. The inset in each panel shows the elemental composition of the coatings by EDS. Images are examples from at least three replicates.
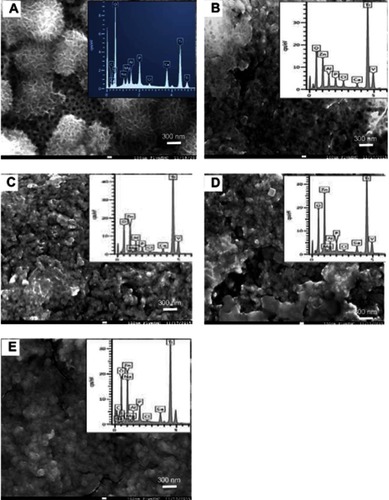
Figure 3 The effect of heat treatment on the composition and the leaching of TiO2–ZnO coating during the synthesis of the composite coating. (A) The total concentration of zinc on the differently heat treated TiO2–ZnO discs before and after exposure to 3SBF by EDS analysis. (B) The total concentration of zinc in the 3SBF measured by ICP-MS after 24 -hr exposure. (C) The concentration of total calcium and phosphorus in the 3SBF measured by ICP-MS after 24-hr exposure. (D) Surface roughness (Ra values) for the different TiO2–ZnO coatings before and after immersion in 3SBF, read by Olympus Laser Microscope LEXT OLS3100. Different letters indicate statistically significant differences (ANOVA or Kruskal–Wallis, P<0.05) between the type of coating for each measurement. Data are mean ± SEM, n=3 replicates per treatment.
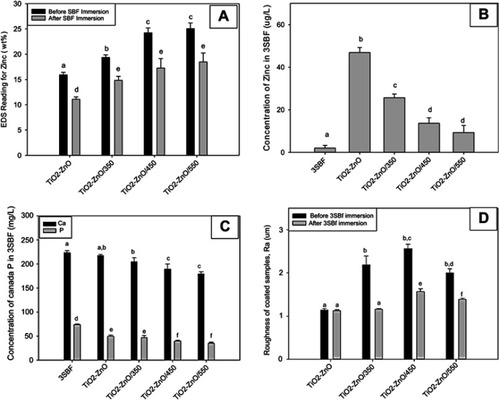
Figure 4 Dialysis of titanium alloy discs coated with either TiO2 NTs (• Symbol), TiO2 NTs decorated with nZnO (TiO2–ZnO/350,▼Symbol), or also with hydroxyapatite (TiO2-ZnO-HA/350, ∆ Symbol) in simulated body fluid (1× SBF). Concentration of (A) total zinc measured by the ICP-MS, (B) total calcium, and (C) total phosphorus measured by the ICP-OES, in SBF from the dialysis in the external compartment of the beakers. Data are single values from triplicate beakers. The curves were fitted to the raw data using a rectangular hyperbola in SigmaPlot.
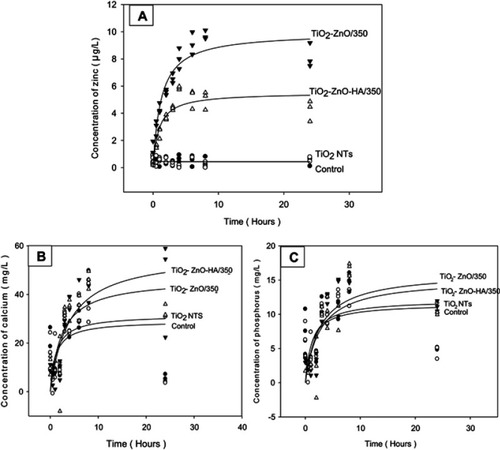
Figure 5 Total concentration of (A) zinc, (B) calcium, and (C) phosphorus, in the exposed broth after 24-hr growth of S. aureus in controls (cell culture plate without any titanium alloy disc), on TiO2 NTs, in the presence of ZnCl2 or a dispersion of nZnO particles alone, or TiO2 NTs decorated with nZnO (TiO2–ZnO/350), or also with hydroxyapatite on the coating (TiO2–ZnO–HA/350). Zinc was measured by ICP-MS and Ca and P by ICP-OES for zinc. Different letters indicate statistically significant differences (Kruskal–Wallis, P<0.05) between the type of coating for each measurement. Data are mean ± SEM, n=6 replicates per treatment.
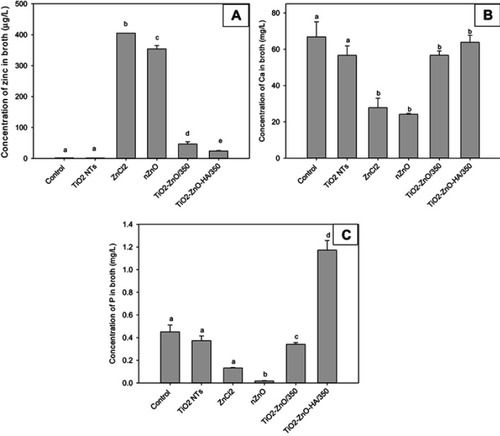
Figure 6 SEM images of attached S. aureus (white structures; examples showed by arrow) after 24-hr culture (A) controls (cell culture plate without any titanium alloy disc), (B) on titanium alloy with TiO2 NTs, (C) in the presence of ZnCl2, or (D) a dispersion of nZnO particles alone, (E) titanium alloy with TiO2 NTs and decorated with nZnO (TiO2–ZnO/350), or (F) also with hydroxyapatite on the coating (TiO2–ZnO–HA/350). Images are representative micrographs from at n=3 replicated samples (scale the same for all images).
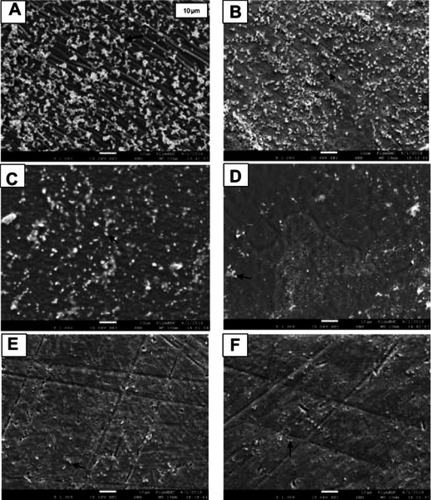
Figure 7 Percent survival (upper panels) and lactate production (lower panels) by S. aureus grown overnight in BHI broth at 37ºC, on controls (cell culture plate without any titanium alloy disc), on TiO2 NTs, in the presence of ZnCl2 or a dispersion of nZnO particles alone, or TiO2 NTs decorated with nZnO (TiO2–ZnO/350), or also with hydroxyapatite on the coating (TiO2–ZnO–HA/350). Panels (A) and (C) are for bacteria attached to the relevant substrate and panels (B) and (D) for microbes remaining suspended in the overlying broth. Different letters indicate statistically significant differences (Kruskal–Wallis, P<0.05) between treatments for each measurement. Data are mean ± SEM, n=6 replicates per treatment.
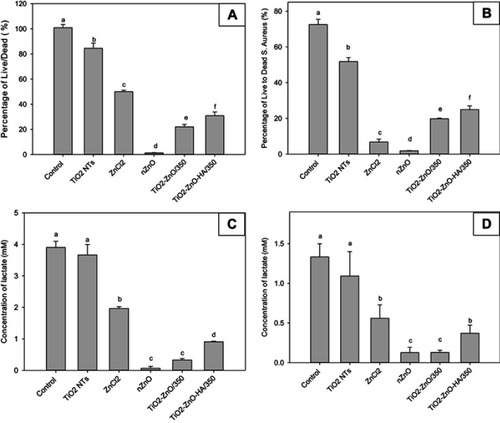
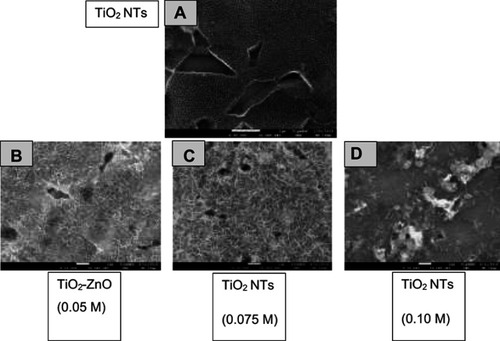
Figure S1 The resulting TiO2 NTs (A), nZnO coatings on TiO2 NTs synthesized in the presence of 0.05 M (B), 0.075 M (C), and 0.10 M (D) zinc nitrate as viewed under the high-resolution scanning electron microscopy.