Figures & data
Table 1 Optimization of Ins/NGs-PEC parameters
Table 2 Treatments received by diabetic rat groups for determination of blood glucose level
Plate 1 Physical appearance of insulin solution at different pH values.
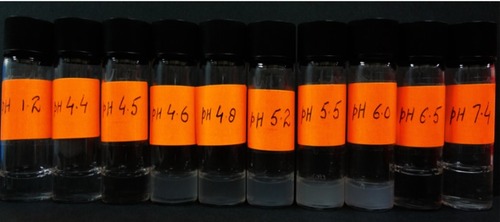
Figure 1 Determination of the isoelectric point in (A) Insulin, (B) Nanogels, and (C) Ins/NGs-PEC. Mean ± SD, n=3.
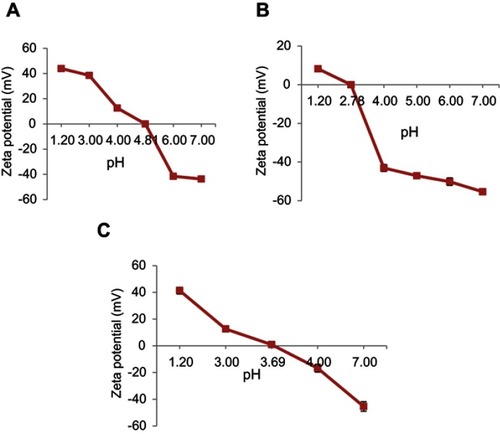
Table 3 Effect of Ins/NG ratios, pH, incubation times and stirring rates on Ins/NGs-PEC properties
Table 4 Lyophilization of InF-12 formulation using trehalose as a cryoprotectant. Mean ± SD, n=3
Figure 2 In-vitro release of insulin from (A) Liquid formulation of InF-12, and (B) Lyophilized formulation of InF12-Tre2 in SGF (pH 1.2) and SIF (pH 6.8) at 37°C. Mean ± SD, n=3.
Abbreviations: SGF, Simulated gastric fluid; SIF, Simulated intestinal fluid.
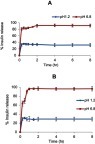
Figure 3 FTIR spectra of (A) Insulin, (B) Nanogels, (C) Trehalose, (D) Lyophilized blank formulation, and (E) Lyophilized InF12-Tre2.
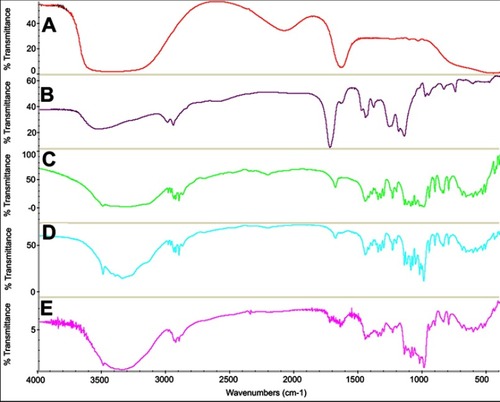
Figure 4 SDS-PAGE results. Lane 1: Unstained low range protein ladder; Lane 2: Insulin released from formulation; Lane 3: Standard insulin.
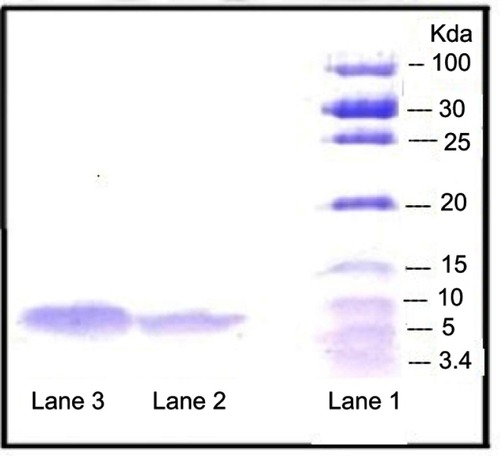
Figure 5 TEM of (A) InF12 before lyophilization and (B) Reconstituted lyophilized InF12-Tre2 after lyophilization.
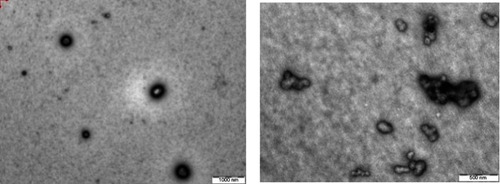
Table 5 The stability data of InF12-Tre2 formulation stored at 5±3°C and 25±2°C/75±15%RH. Mean ± SD, n=3
Figure 6 In-vitro release profile of lyophilized InF12-Tre2 formulation stored at 5±3°C in (A) SGF, and (B) SIF. Mean ± SD, n=3.
Abbreviations: SGF, Simulated gastric fluid; SIF, Simulated intestinal fluid; T0M, Time at zero month (immediately after preparation); T1M, Time at one month; T2M, Time at two months; T3M, Time at three months.
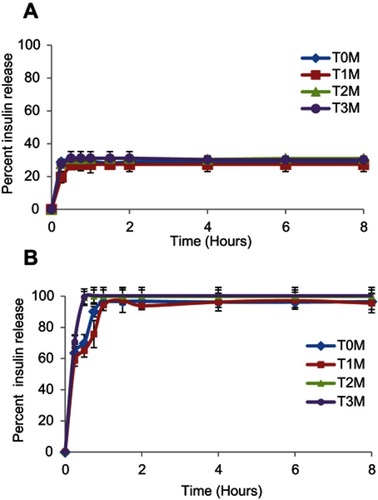
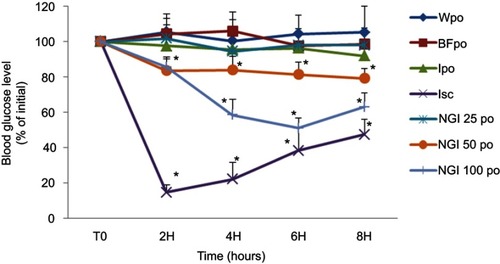
Figure 7 Effect of oral administration of the three doses (25, 50 and 100 IU/kg body weight) of lnF12-Tre2 and four control groups on the percentage reductions in blood glucose level in the streptozotocin-induced diabetic rats.*Statistically significant difference to BFpo. Mean ± SD, n=6. Data points represent relative values of the initial blood glucose concentration.
Abbreviations: Wpo, water per oral; BFpo, blank formulations per oral; Ipo, insulin per oral; Isc, insulin subcutaneous; NGI 25 po, InF12-Tre2 containing insulin 25 IU per oral; NGI 50 po, InF12-Tre2 containing insulin 50 IU per oral; NGI 100 po, InF12-Tre2 containing insulin 100 IU per oral.