
Figures & data
Figure 1 Negatively stained transmission electron microscopy (TEM) of the ultrasmall superparamagnetic iron oxide (USPIO)–polyethylene glycol (PEG)–Sialyl Lewis X (sLex) nanoparticles. The nanoparticles are well separated by the PEG shell.
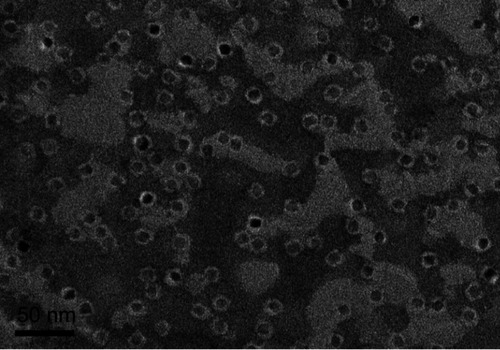
Figure 2 Dynamic light scattering (DLS) of ultrasmall superparamagnetic iron oxide (USPIO)–polyethylene glycol (PEG) and USPIO-PEG–Sialyl Lewis X (sLex).
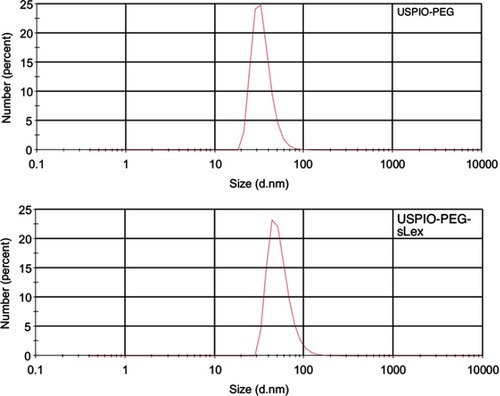
Figure 3 ζ-potential of ultrasmall superparamagnetic iron oxide (USPIO)–polyethylene glycol (PEG) and USPIO-PEG–Sialyl Lewis X (sLex).
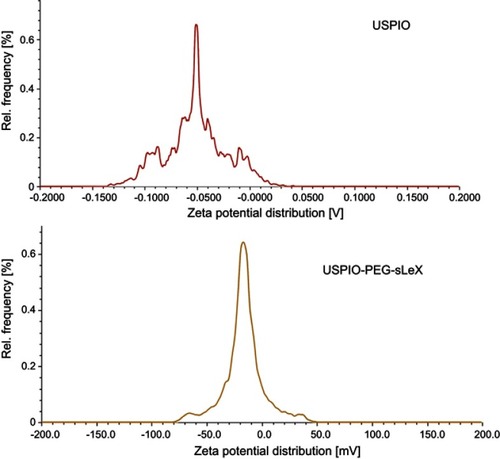
Figure 4 Thermogravimetric analysis (TGA) of ultrasmall superparamagnetic iron oxide (USPIO), USPIO–polyethylene glycol (PEG), and USPIO-PEG–Sialyl Lewis X (sLex).
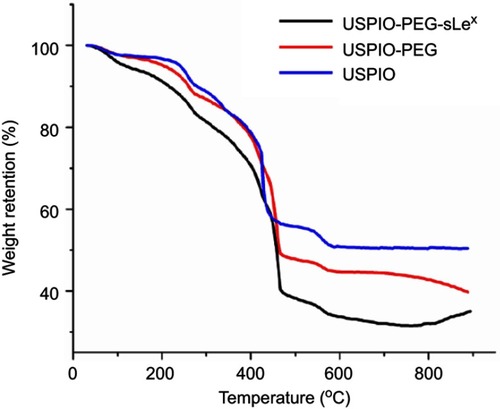
Figure 5 Fourier-transform infrared (FTIR) spectra of ultrasmall superparamagnetic iron oxide (USPIO; (black) and USPIO–polyethylene glycol (PEG)–Sialyl Lewis X (sLeX; red).
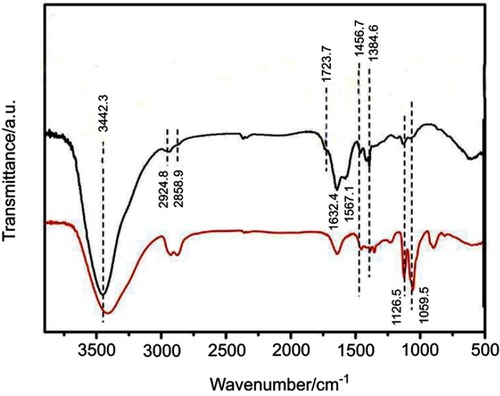
Figure 6 Relaxivity (R1 and R2) versus ultrasmall superparamagnetic iron oxide (USPIO)–polyethylene glycol (PEG)–Sialyl Lewis X (sLeX) concentration.
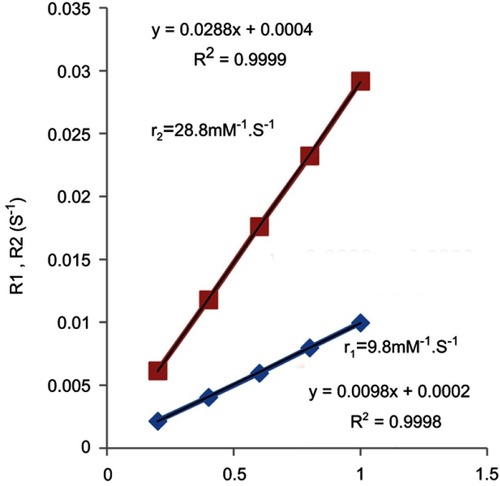
Table 1 Image parameters and mean optical density (MOD) of primary tumors in footpads in the metastasis group and control group
Figure 7 Representative images of primary footpad tumor and metastatic inguinal lymph nodes.
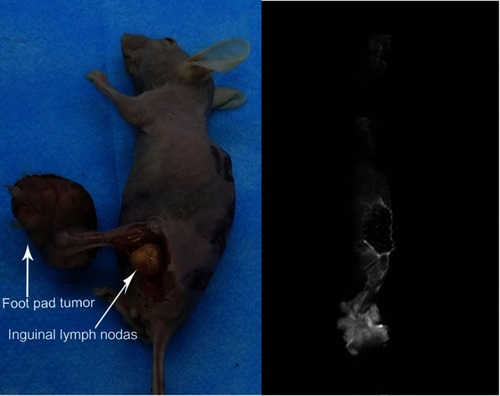
Figure 8 T2* value, ΔT2* value and enhancement rate (ER) at different time points in metastasis group and control group.
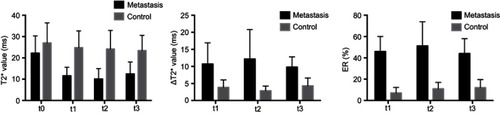
Figure 9 T2* mapping shows effect of ultrasmall superparamagnetic iron oxide (USPIO)–polyethylene glycol (PEG)–Sialyl Lewis X (sLeX) contrast agent on images of primary tumors in footpads.
Notes: Color scale used for magnetic resonance imaging (MRI) signal-intensity mapping with software. Top row, T2* mapping of metastasis group at t0, t1, t2, and t3. Bottom row, T2* mapping of control group at t0, t1, t2, and t3. In both mice, USPIO-PEG-sLex was administered via the tail vein.
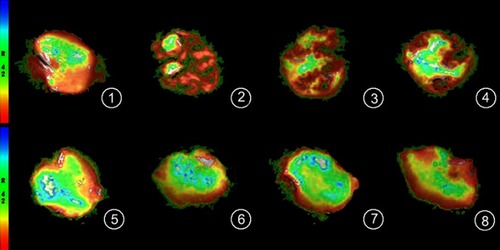
Figure 10 T2* of primary tumors in footpads in metastasis group and control group before and after intravenous administration of ultrasmall superparamagnetic iron oxide (USPIO)–polyethylene glycol (PEG)–Sialyl Lewis X (sLeX).
Notes: There was a rapid decrease in mice with metastasis that were given the targeting agent USPIO-PEG-sLeX. T2* changes in tumors in the control group were relatively gentle. Data points are show mean ± SD.
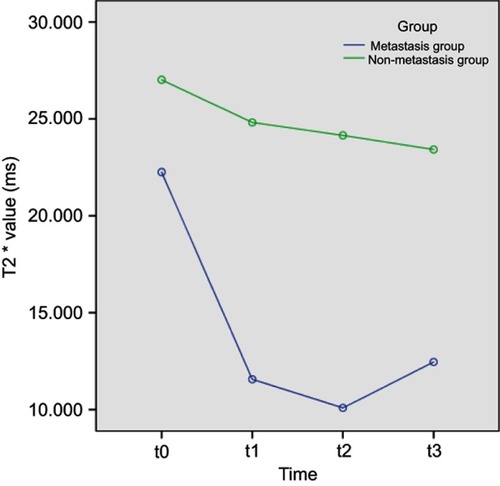
Figure 11 Results of histological examination of lymph (H&E stain, original magnification 400×) and transplanted tumors (immunohistochemical [IHC], original magnification 400×).
Notes: Top row, metastasis group; bottom row, control group.
![Figure 11 Results of histological examination of lymph (H&E stain, original magnification 400×) and transplanted tumors (immunohistochemical [IHC], original magnification 400×).Notes: Top row, metastasis group; bottom row, control group.](/cms/asset/ad9b789f-fdff-4d7b-ad24-61d8d8dae80f/dijn_a_12190840_f0011_c.jpg)
Figure 12 Immunohistochemical (IHC) staining in metastasis group and control group. E-selectin preferentially upregulated in metastasis group.
Abbreviation: MOD, mean optical density.
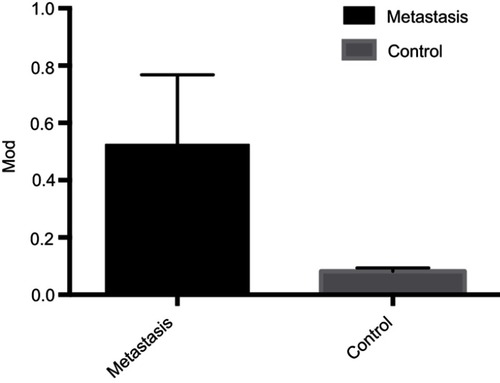
Table 2 Associations between image parameters and mean optical density assessed by Spearman's correlation coefficient
Figure 13 Correlations among image parameters.
Notes: T2* value, ΔT2* value, and enhancement rate (ER) of t1, t2, and t3 and mean optical density (MOD; calculated from immunohistochemistry images by ImageJ). Six parameters (T2* value [t2], ΔT2* value [t1,t2], and ER [t1, t2, and t3]) were related to the MOD. Neither T2* value (t1 and t3) nor ΔT2* value (t3) correlated with MOD. Abbreviation: MOD, mean optical density.
![Figure 13 Correlations among image parameters.Notes: T2* value, ΔT2* value, and enhancement rate (ER) of t1, t2, and t3 and mean optical density (MOD; calculated from immunohistochemistry images by ImageJ). Six parameters (T2* value [t2], ΔT2* value [t1,t2], and ER [t1, t2, and t3]) were related to the MOD. Neither T2* value (t1 and t3) nor ΔT2* value (t3) correlated with MOD. Abbreviation: MOD, mean optical density.](/cms/asset/07db9050-854d-4bb8-a6c7-ccb1a9775e13/dijn_a_12190840_f0013_b.jpg)