Figures & data
Scheme 1 Schematic illustration of the preparation of different titanium-based substrates.
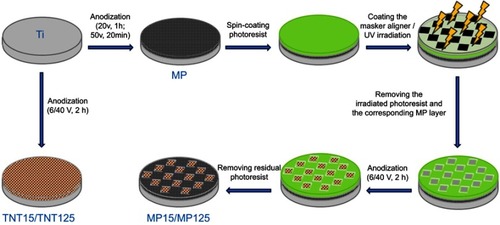
Table 1 Real-time polymerase chain reaction primers used in this study
Figure 1 (A) Scanning electron microscopy images of different substrates (left: low magnification; right: high magnification); (B) top view and cross-section images of MP125 in different area; (C) pore size statistics of mesoporous and nanotube.
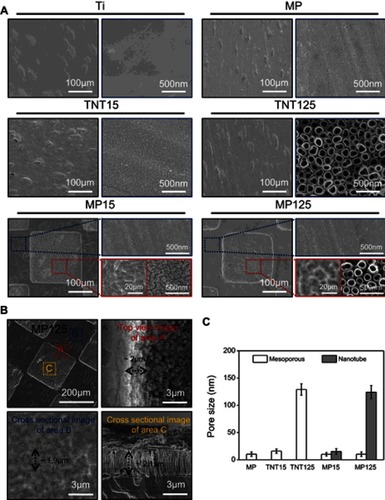
Figure 2 (A) Representative images of water contact angles; (B) statistics of water contact angle of different substrates.
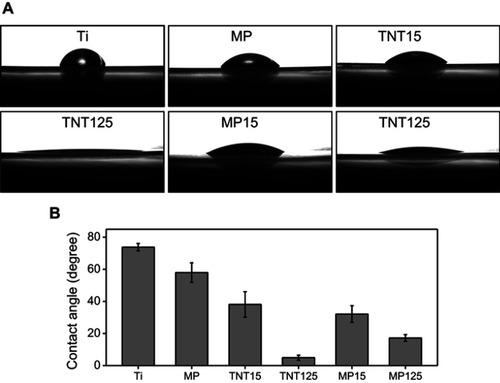
Figure 3 (A) Optical and scanning electron microscopy images of different substrates before and after ultrasonic treatment; (B) UV absorption spectrum of TiO2 fragments in different soaking solutions and the representative SEM image of TNT125 fragments in soaking water; (C) representative scratch track image of different samples (1–20 N).
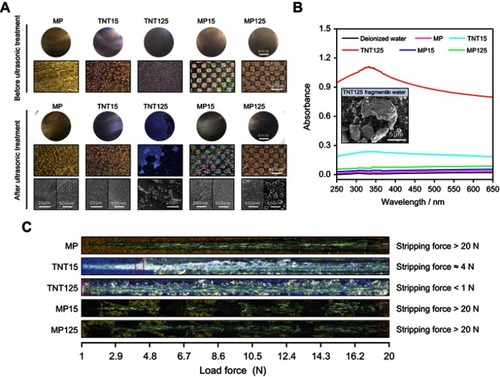
Figure 4 (A) Statistics of adsorbed FITC-BSA protein on different samples at 10, 30 and 120 mins; (B) representative fluorescent images of adsorbed FITC-BSA protein at 120 mins. Error bars represent mean ± SD for n=6, *p<0.05.
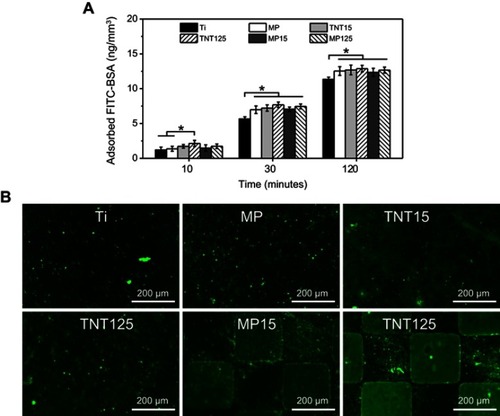
Figure 5 (A) Representative fluorescent images of adherent MC3T3-E1 cells at 1, 3 and 5 hrs; statistics of cell numbers (B) and spreading area (C) (at 5 hrs) according to fluorescent images. Error bars represent mean ± SD for n=6, *p<0.05.
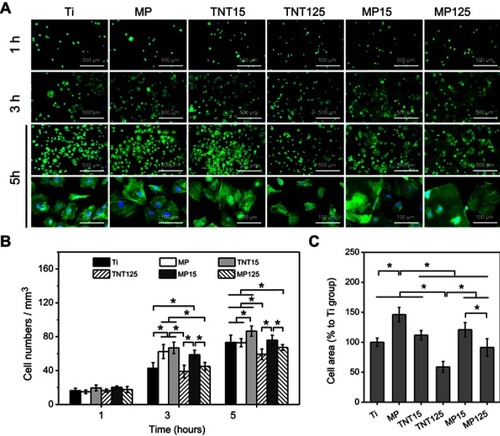
Figure 6 (A) Cell viability of MC3T3-E1 cells at 1, 5, 10 and 15 d; statistics of ALP activity (B) and mineralization level (C) at 10 d. Error bars represent mean ± SD for n=6, *p<0.05.
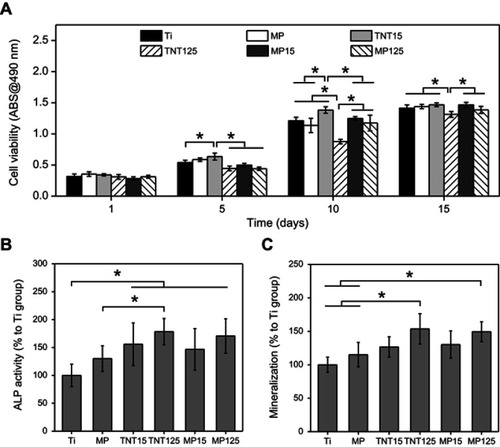
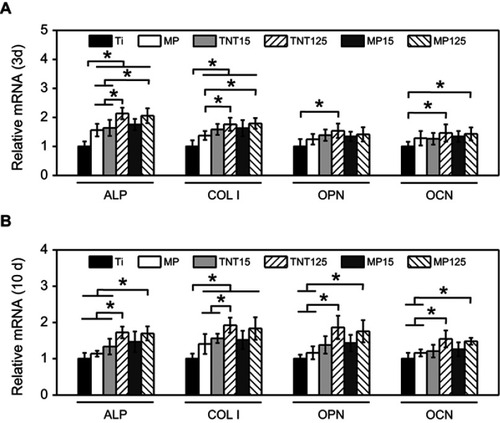
Figure 7 Expression of ALP, COL Ⅰ, OPN and OCN genes in MC3T3-E1 cells on different substrates at 3 d (A) and 10 d (B). Error bars represent mean ± SD for n=6, *p<0.05.