Figures & data
Table 1 Particle size and zeta potential of nanoparticles
Figure 1 Particle size distribution of coumarin-6-labeled ENP.
Abbreviation: ENP, EGFP-EGF1-conjugated poly(lactic-co-glycolic acid) nanoparticle.
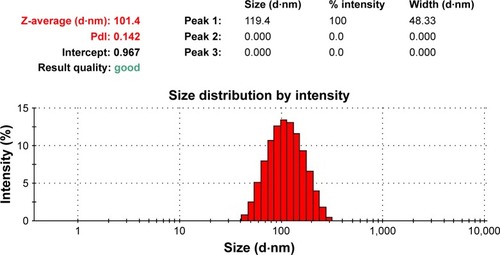
Figure 2 TF expression in VSMCs at different timepoints. The experiments were performed in triplicate to calculate the average value of each group. Data are presented as mean ± SEM. The TF mRNA levels from the different treated cells were normalized to the control one; #P<0.05.
Abbreviations: TF, tissue factor; VSMCs, vascular smooth muscle cells; SEM, standard error of mean; h, hours.
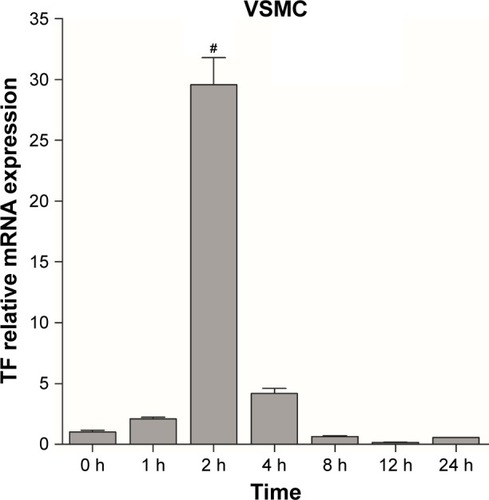
Figure 3 Uptake of coumarin-6 nanoparticles by stimulated VSMCs.
Notes: (A) Shows the ENP group of cells. (B) Shows the NP group of cells. (C) Shows cells incubated with PBS only (0.01 M, pH 7.4). Nuclei are stained with DAPI (blue). Scale bar: 100 nm.
Abbreviations: VSMCs, vascular smooth muscle cells; ENP, EGFP-EGF1-conjugated poly(lactic-co-glycolic acid) nanoparticle; NP, nanoparticle; FITC, fluorescein isothiocyanate.
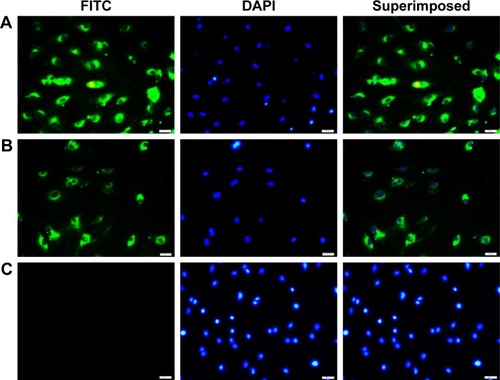
Figure 4 Cell fluorescence intensity of VSMCs.
Notes: The experiment was repeated three times to calculate the average fluorescence intensity of each group, and the histogram was obtained based on NP group. Data are presented as mean ± SEM; *P=0.001.
Abbreviations: VSMCs, vascular smooth muscle cells; NP, nanoparticle; SEM, standard error of mean; ENP, EGFP-EGF1-conjugated poly(lactic-co-glycolic acid) nanoparticle; Geo, geometric.
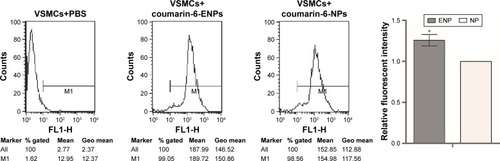
Figure 5 (A) Oil red O staining of frozen sections of the aorta, arrowhead showing lipid deposition on the arterial wall. (B) TF mRNA expressions in aorta of mouse atherosclerosis models fed with high-fat diets for various lengths of time. Data are presented as mean ± SEM; ∆∆P<0.05.
Abbreviations: TF, tissue factor; SEM, standard error of mean; w, weeks.
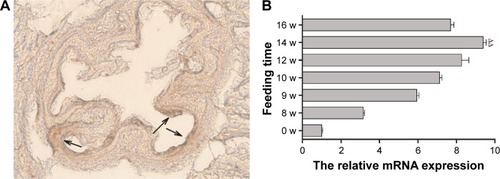
Figure 6 Organ imaging of DiR-ENPs in atherosclerosis mice.
Notes: (A) Shows the fluorescence imaging of the mouse aorta. (B) Shows the fluorescence intensity of different organs, and the histogram was analyzed by statistical analysis. Data are presented as mean ± SEM (n=6 per group); **P<0.05.
Abbreviations: DiR, 1,1′-dioctadecyl-3,3,3′,3′-tetramethylindotricarbocyanine iodide; ENPs, EGFP-EGF1-conjugated poly(lactic-co-glycolic acid) nanoparticle; SEM, standard error of mean; NP, nanoparticle; HFD, high-fat diet; CHD, normal diet.
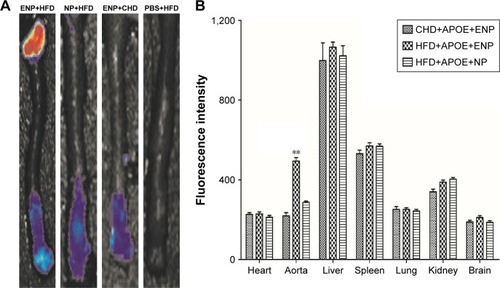
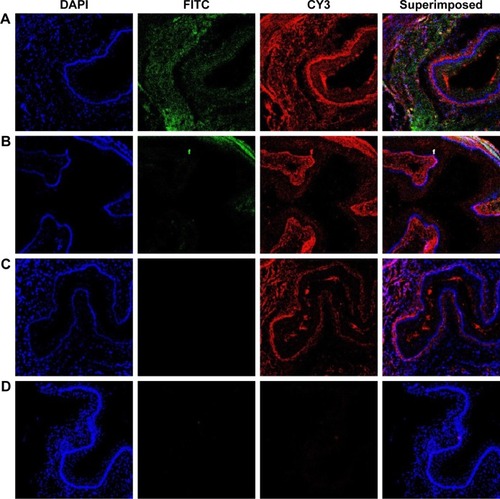
Figure 7 Laser confocal observation of the distribution of nanoparticles in the aorta of atherosclerosis model mice.
Notes: (A) Shows the aorta after injection of DiR-ENPs into the atherosclerosis mouse model of HFD group. (B) Shows the aorta after injection of DiR-ENPs in CHD group. (C) Shows the aorta after injection of DiR-NPs in HFD group. (D) is the aorta after PBS injection in HFD group, no incubation with TF antibody. FITC-labeled EGFP-EGF1 site is shown in green and CY3-labeled TF expression site in red. Nuclei were stained with DAPI (blue).
Abbreviations: DiR, 1,1′-dioctadecyl-3,3,3′,3′-tetramethylindotricarbocyanine iodide; ENPs, EGFP-EGF1-conjugated poly(lactic-co-glycolic acid) nanoparticle; TF, tissue factor; HFD, high-fat diet; CHD, normal diet; FITC, fluorescein isothiocyanate.