Figures & data
Figure 1 Con A based AVT particles: Liposomes bearing PEG-sugar conjugates on their external surface are agglomerated by free con A.
Table 1 Pharmacodynamic parameters of the untreated and the treated group during the three glucose excursions
Figure 2 Size distributions measured by Fraunhofer Diffraction of con A-linked liposomes before and upon cleavage by free glucose.
Figure 3 Aerodynamic characterization of the agglomerated liposomes by cascade impactor.
Figure 4 Blood glucose concentration over the period of ~6 hrs of the untreated group (n = 3), treated group with lung instillation of the AVT particle containing 1.4 IU/kg (n = 3), and the treated group with lung instillation of the AVT particle containing 1.4 IU/kg followed by hyperglycemic events (n = 4). The asterisk and the double cross indicate significant statistical difference based on two-tailed student’s t-test (p < 0.05, a = 0.05) between the treated group in the presence of hyperglycemic events and the control group and between the two treated groups respectively.
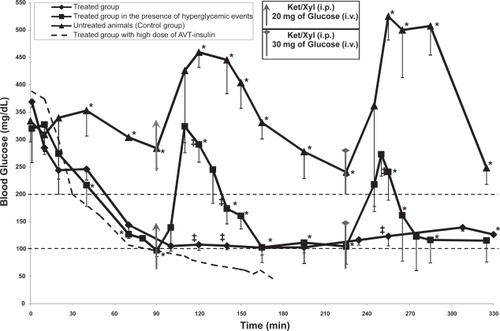
Figure 5 A comparison of the control and the AVT-treated group during the 3 hyperglycemic events. The shaded areas indicate the areas under the curve (AUCe) for each excursion.
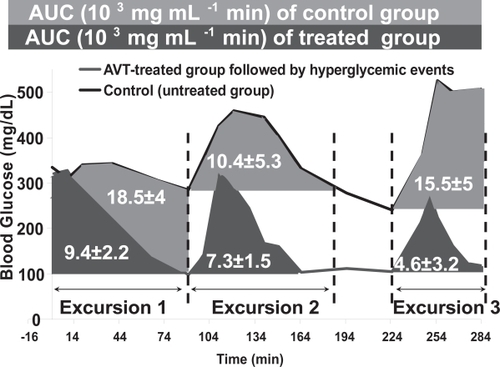
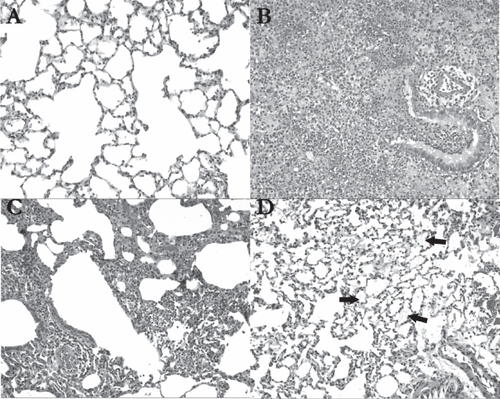
Figure 6 Histological analysis of hematoxylin-eosin stained lung tissue 24 hrs after treatment (original magnification 100X); (A) In saline-treated animals (n = 2), the lung tissue was almost entirely normal, as shown in this view; (B) The con A-treated rats (n = 2) demonstrated extensive pneumonic changes in their lungs. A bronchiole and adjacent alveoli show mixed inflammatory cell infiltrates including neutrophils and lymphocytes, accompanied by alveolar hemorrhage; (C) In liposome-treated animals (n = 2), patchy lymphocytic infiltrates were noted around a bronchiole, blood vessels, and in the interstitium in the left upper lobe of one of the rats receiving the liposomes; (D) In AVT-treated animals (n = 2), alveolar material is focally visible (see arrows) in the lungs, and may represent remnants of the particles (original magnification 100X).