Figures & data
Figure 1 (a) TEM image of nanoCaP/CDDP conjugates. (b) Particle size analysis of nanoCaP/CDDP conjugates redispersed in H2O at 1 mg/mL concentration. NanoCaP/CDDP particle size = 106.5 ± 35.4 nm (mean size ± standard error, 50% below 101.1 nm, 90% below 163.3 nm), Z-potential = −27.9 mV. The control NanoCaP: Particle size = 129 ± 33 nm, 50% below 125.4 nm, 90% below 181.3 nm. Z-potential = −45.59 mV.
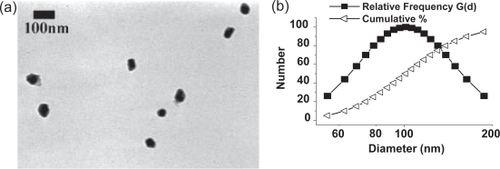
Figure 2 FTIR spectrum of (a) DARVAN 811 (b) Commercial hydroxyapatite standard and (c) NanoCaP formed in the presence of DARVAN 811 (d) NanoCaP/CDDP conjugates.
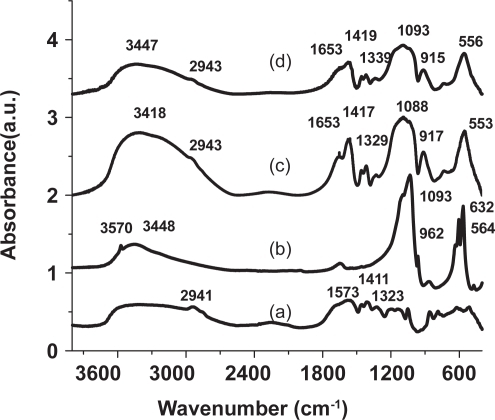
Figure 3 XRD spectrum of nanoCaP particles compared to a hydroxyapatite standard (JCPDS, #09-0432).
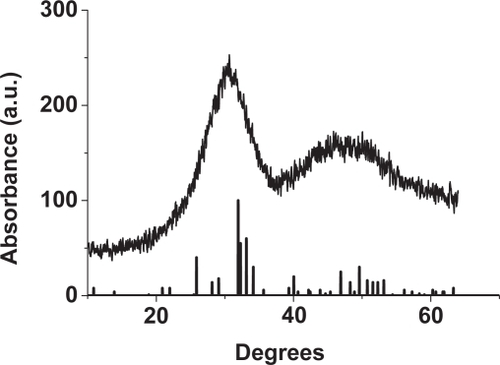
Figure 4 Drug release profile of nanoCaP/CDDP conjugates (88 ug/mg loading). (a) Amount of CDDP released over time in PBS, pH = 7.4 (b) Cumulative release over time of CDDP in PBS, pH = 7.4.
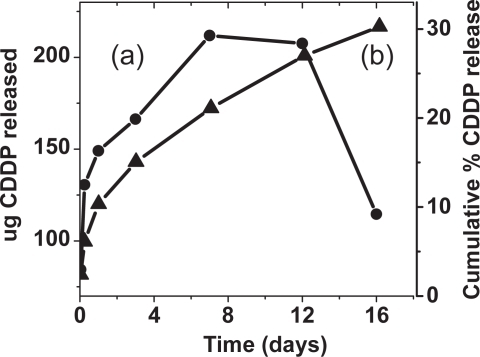
Figure 5 Comparison of IC50 values obtained for the cytotoxicity testing of CDDP released after incubation of the nanoconjugates in PBS: (a) Free drug control, (b) CDDP released from the nanoCaP/CDDP conjugates. (c)–(e) are from the direct addition study: (c) Free drug control, (d) NanoCaP + Free drug. (e) Nano-CaP/CDDP conjugates particles directly added to the cells. (*) denotes significant difference (p < 0.05, Student’s T-test) from free drug control.
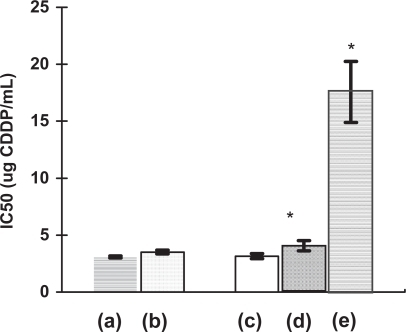
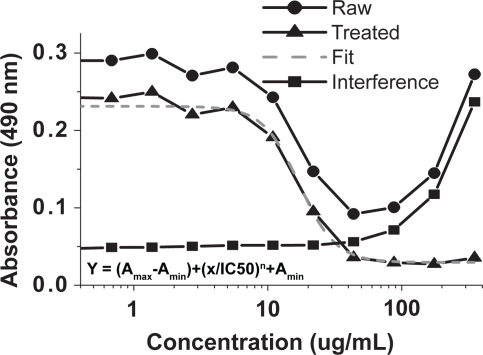
Figure 6 Demonstration of IC50 value determination of nanoCaP/CDDP conjugates on A2780Cis cancer cell lines. NanoCaP and nanoCaP/CDDP conjugate particles have interference around 490 nm at higher concentrations (see interference plot above). This interference was determined at the same test conditions but without adding Celltiter96 solution. It is subtracted from the raw data to give treated data (treated = raw–interference). The 4-parameter sigmoidal fit of this treated data is used to calculate the IC50 value.