
Figures & data
Figure 1 Fabrication and characterization of lipid nanoparticle (LNs). (A) General procedure of fabricating LNs. (B) Particle sizes of our laboratory-made LNs. (C) Apparent zeta potential of our laboratory-made LNs. (D) Scanning electron microscope images of the nanoparticles. Scale bar, 200 nm.
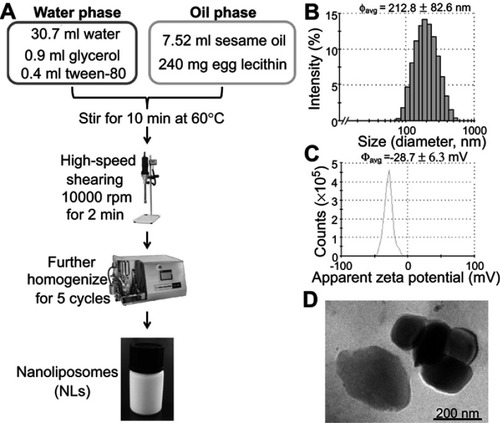
Figure 2 Treatment of lipid nanoparticles (LNs) reduced the viability of Raw264.7 macrophages in a dose- and time-dependent manner. (A) Representative figures of Raw264.7 cells after treatment with 250 μg/mL LNs for various periods. Scale bar, 50 μm. (B) MTT assay revealed the ET50 of LNs was 2.12 hrs. Each point represents an average of duplicates from three individual experiments. (C) Representative figures of Raw264.7 cells after treatment with various concentrations of LNs for 5 hrs. Scale bar, 50 μm. (D) MTT assay revealed the EC50 of LNs was 136 μg/mL. Each point represents an average of duplicates from three individual experiments.
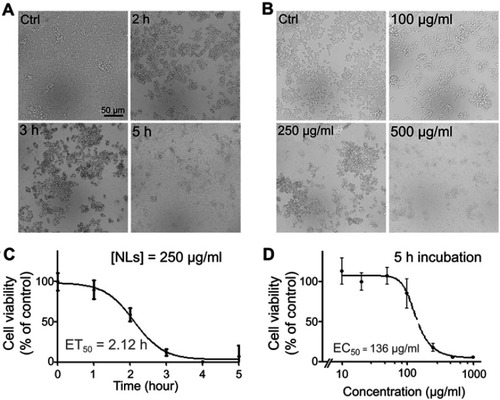
Figure 3 Lipid nanoparticle (LN) induced apoptosis of Raw264.7 cells in vitro. Apoptotic cells were stained with Annexin-V-FITC and PI and observed by fluorescence microscope (magnification ×200) after treatment (A) for various periods or (B) with different concentrations. Green fluorescence indicated cells underwent an early phase of apoptosis while red fluorescence indicated late phase apoptosis. Scale bar, 50 μm. Flow cytometry was also used for separating phases of apoptosis after treatment of LNs either (C) for various periods or (D) with different concentrations.
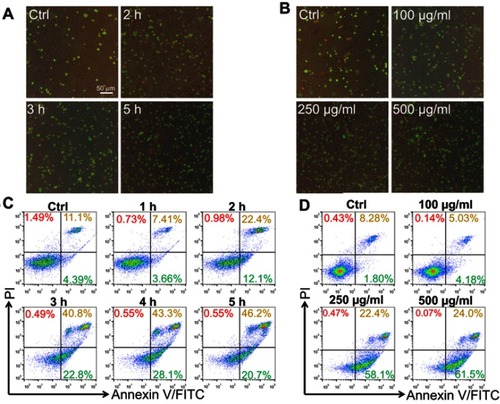
Figure 4 Lipid nanoparticle (LN) treatment disrupted mitochondria of Raw264.7 cells. (A) Swelled or broken mitochondria were observed in Raw264.7 cells after the application of LNs (magnification× 5,000). The blue arrow indicates swollen or broken mitochondria. (B) Flow cytometry revealed a shift of the mitochondrial membrane from polarized state (red fluorescence) to depolarized state (green fluorescence) after application of LNs in a time-dependent manner.
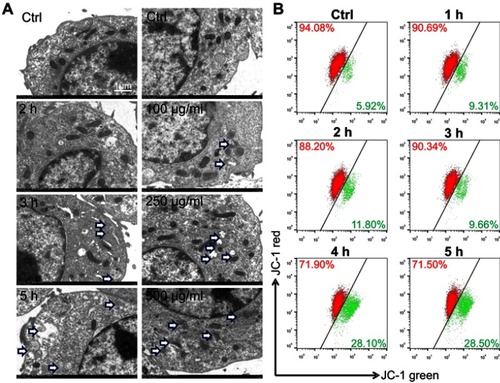
Figure 5 Lipid nanoparticle (LN) treatment varied expression levels of apoptosis-related proteins in Raw264.7 cells. (A) Representative western blot images and (B) summary of expression changes among Bax, Bcl-2, Caspase-3, and PARP. The expression of β-actin was used as a loading control. Each bar represents an average of four independent experiments.
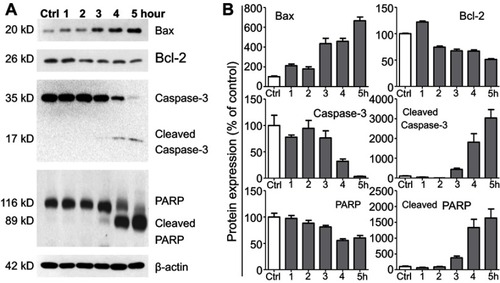
Figure 6 Short-term application of lipid nanoparticles (LNs) revealed its acute toxicity on Kupffer cells in liver specimens from mice. (A) Detailed protocol of LN short-term oral application to mice. (B) H&E staining of liver specimen under the application of different concentrations of LNs. Scale bar, 60 μm. (C) Representative images and (D) summary of immunofluorescence staining of lysozyme (marker of resident macrophages in liver). Scale bar, 50 μm. *represents significant difference with P<0.05.
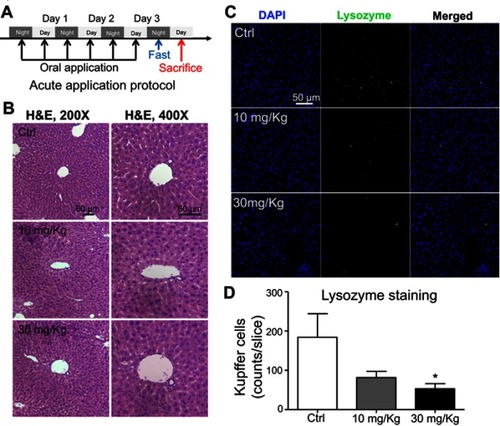
Figure 7 Chronic toxicity on Kupffer cells observed after long-term application of lipid nanoparticles (LNs). (A) Detailed protocol of LN long-term oral application to mice. (B) H&E staining of liver specimen under the application of LNs. Scale bar, 50 μm. (C) Representative images and (D) summary of immunofluorescence staining of lysozyme (marker of resident macrophages in liver). Scale bar, 50 μm. ***represents significant difference with P<0.001.
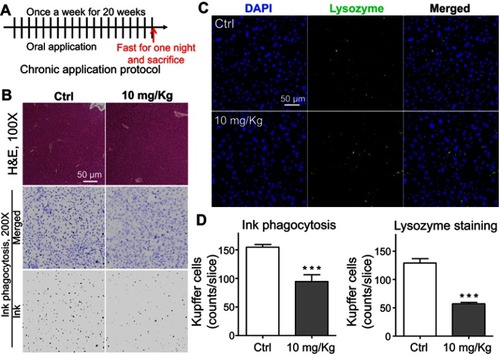
Figure S1 LNs did not cause obvious damage on hepatocytes. (A) Apoptotic detection of L02 cells treated with various concentrations of LNs. (B) MTT analysis of L02 and HepG-2 cells treated with LNs.
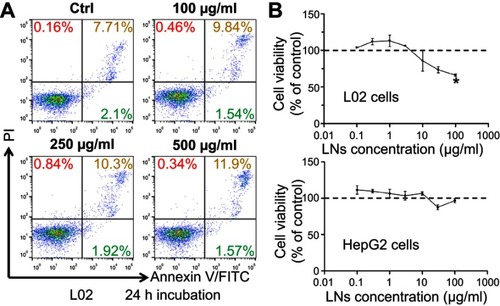
Figure S2 MTT analysis of major components in LNs. (A) Cell viability of different concentrations of egg yolk lecithin on Raw264.7 cells. (B) Cell viability of different concentrations of sesame oil on Raw264.7 cells. (C) Cell viability of different concentrations of Tween-80 on Raw264.7 cells. ** and ***represent significant difference from control with P<0.01 and 0.001, respectively.
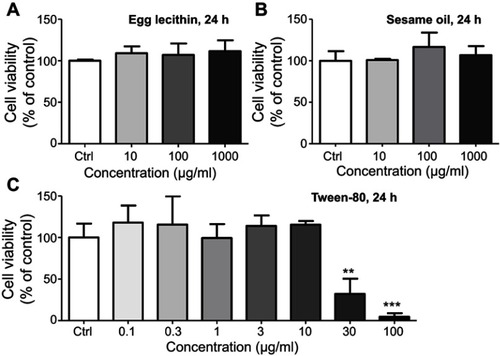
Table S1 No obvious change was detected in serum biochemistry study among groups after short-term application of LNs